Fig. C.1.
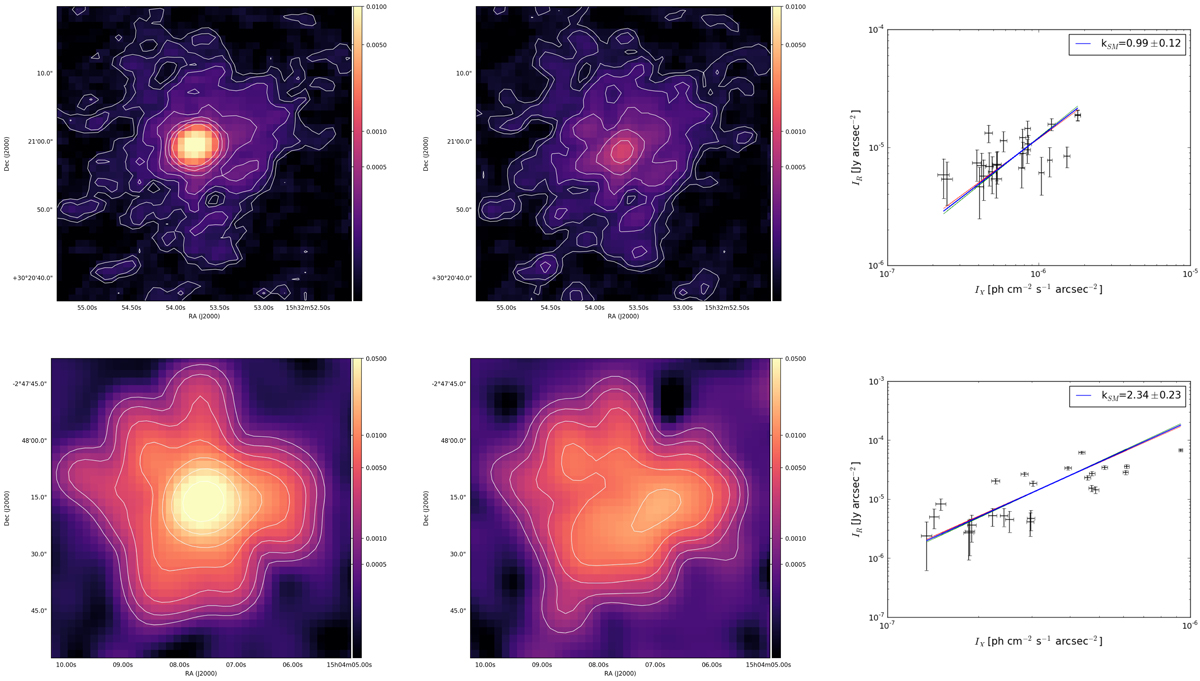
Top: RX J1532.9+3021, before (left) and after the subtractions (center). The contours are at 2, 4, 8, 16, 32, and 64 × 22 μJy beam−1. The plot (right) is the result of the SMptp analysis performed on the subtracted image with the same grid presented in B.3. bottom: RXC J1504.1−0248, before (left) and after the subtractions (center). The contours are at 2, 4, 8, 16, 32, and 64 × 0.9 mJy beam−1. The plot (right) is the result of the SMptp analysis performed on the subtracted image with the same grid presented in Fig. B.3.
Current usage metrics show cumulative count of Article Views (full-text article views including HTML views, PDF and ePub downloads, according to the available data) and Abstracts Views on Vision4Press platform.
Data correspond to usage on the plateform after 2015. The current usage metrics is available 48-96 hours after online publication and is updated daily on week days.
Initial download of the metrics may take a while.