Fig. 7.
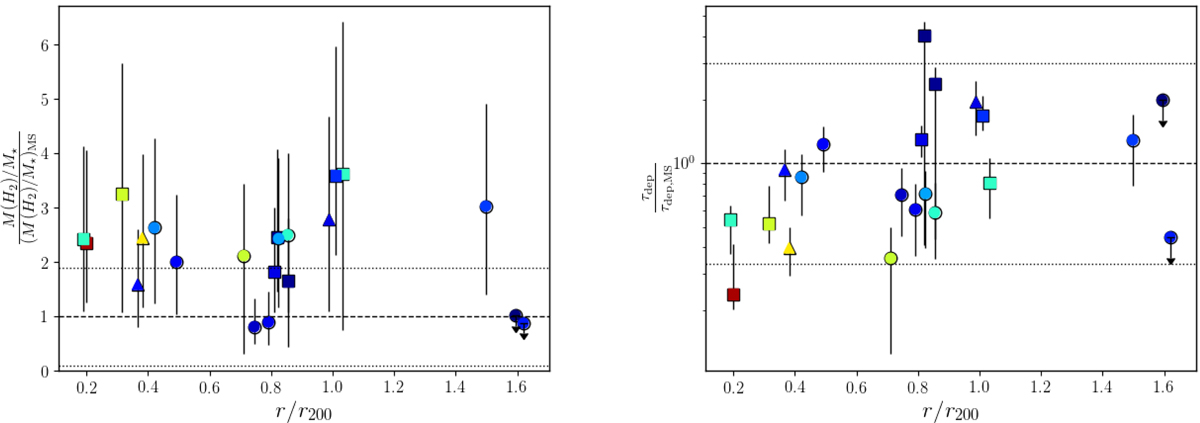
Molecular gas to stellar mass ratio (left) and depletion time (right), normalized to the corresponding MS values, as a function of r/r200. The data points have different symbols and are color-coded according to the corresponding SFR/SFRMS, as in Fig. 6. In each panel, the horizontal dashed line refers to the MS value, while the horizontal dotted lines show the range of y-axis values corresponding to MS galaxies.
Current usage metrics show cumulative count of Article Views (full-text article views including HTML views, PDF and ePub downloads, according to the available data) and Abstracts Views on Vision4Press platform.
Data correspond to usage on the plateform after 2015. The current usage metrics is available 48-96 hours after online publication and is updated daily on week days.
Initial download of the metrics may take a while.