Fig. 6.
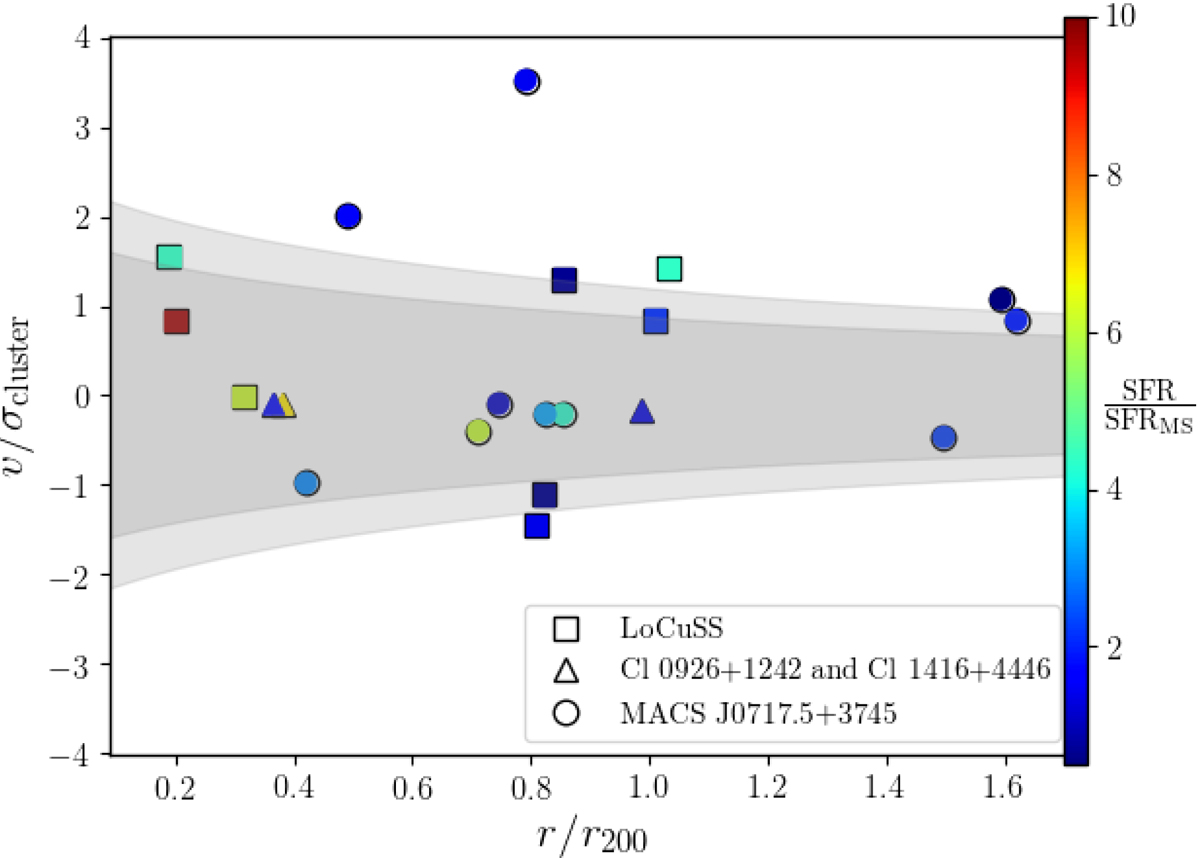
Phase space diagram for all cluster galaxies in our sample. In the x-axis we plot the projected cluster centric radius, r, normalized to r200, while in the y-axis we plot the line-of-sight velocity, normalized to the cluster velocity dispersion σcluster. The dark and light gray areas show the range of virialized regions defined by Jaffé et al. (2015) for the clusters in our sample.
Current usage metrics show cumulative count of Article Views (full-text article views including HTML views, PDF and ePub downloads, according to the available data) and Abstracts Views on Vision4Press platform.
Data correspond to usage on the plateform after 2015. The current usage metrics is available 48-96 hours after online publication and is updated daily on week days.
Initial download of the metrics may take a while.