Fig. 5.
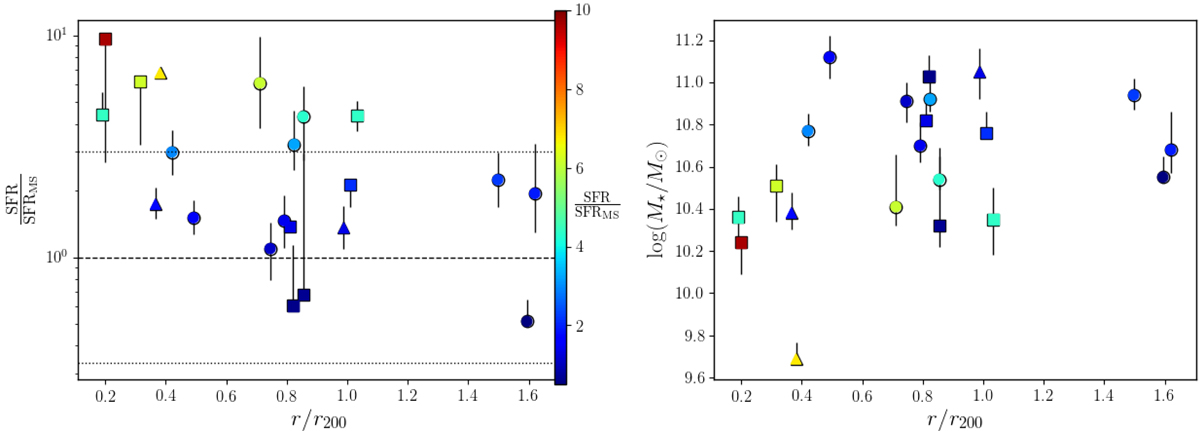
Star formation rate to SFRMS (left panel) and stellar mass (right panel), as a function of r/r200 of the LIRGs. Symbols are shown as in Fig. 3b. Blue, green, yellow, and red data points correspond to increasing SFR/SFRMS values, as illustrated in the color bar (left). Left panel: the horizontal dashed line refers to the MS value, while the horizontal dotted lines show the ±0.48 dex scatter corresponding to MS galaxies.
Current usage metrics show cumulative count of Article Views (full-text article views including HTML views, PDF and ePub downloads, according to the available data) and Abstracts Views on Vision4Press platform.
Data correspond to usage on the plateform after 2015. The current usage metrics is available 48-96 hours after online publication and is updated daily on week days.
Initial download of the metrics may take a while.