Fig. 3.
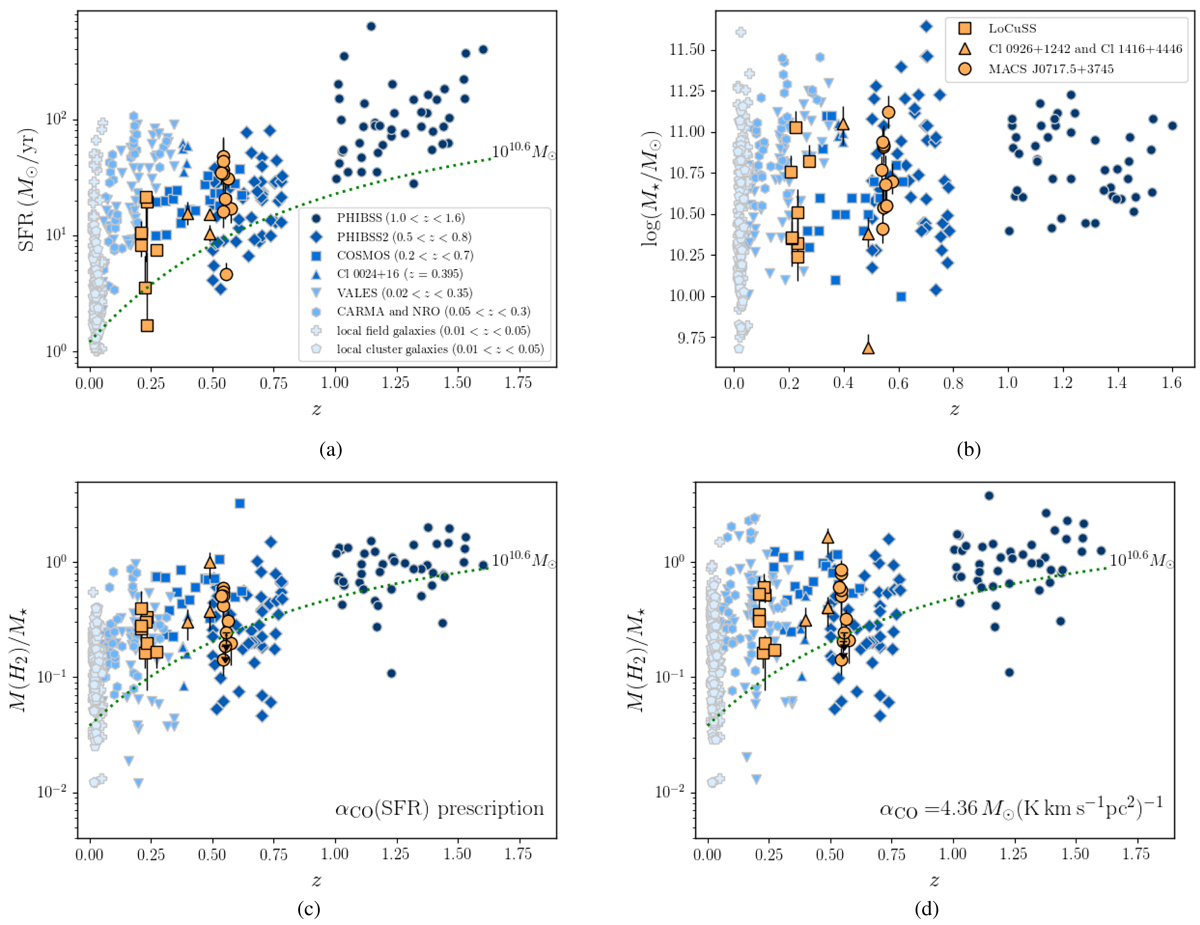
a: SFR vs.z and b: M⋆vs.z scatter plots. The green dotted line in panel a shows the empirical SFR values by Speagle et al. (2014) for MS field galaxies (SFRMS) with stellar mass log(M⋆/M⊙) = 10.6, which corresponds to the mean stellar mass for the LIRGs in our sample. c,d: molecular gas to stellar mass ratio as function of redshift; the two plots differ in terms of the adopted αCO, as shown at the bottom right of the panels. The green dotted lines show the empirical values found by Tacconi et al. (2018) for MS field galaxies with a stellar mass log(M⋆/M⊙) = 10.6. The color code for the data points is given in panels a,b.
Current usage metrics show cumulative count of Article Views (full-text article views including HTML views, PDF and ePub downloads, according to the available data) and Abstracts Views on Vision4Press platform.
Data correspond to usage on the plateform after 2015. The current usage metrics is available 48-96 hours after online publication and is updated daily on week days.
Initial download of the metrics may take a while.