Fig. A.3.
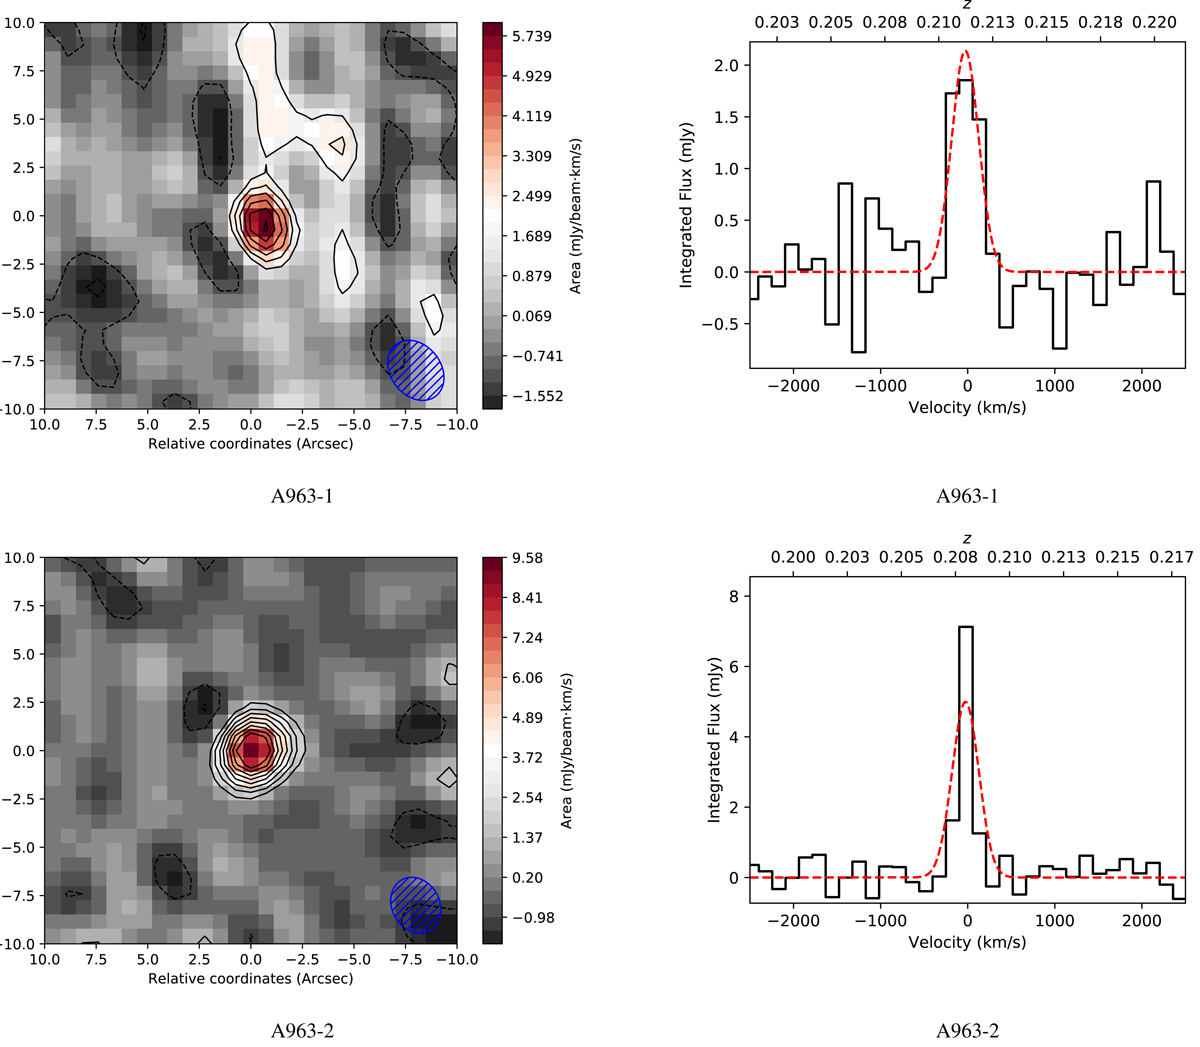
Left: clean intensity maps showing the CO detections obtained with NOEMA. Coordinates are reported as angular separations from the target sources. For each map, the velocity range considered corresponds to the velocity support associated with the corresponding CO emission line, see right panels. The solid and dashed contour levels are superimposed and correspond to positive and negative fluxes, starting from +2σ and −1σ levels, respectively. Consecutive levels correspond to an absolute increment of 1σ in significance. The dashed ellipses (bottom right) show the beam size. Right: spectrum (black solid line) obtained with NOEMA within an aperture corresponding to the beam size at the location of the detection, as reported in the left panels. The best fits, baseline subtracted, are reported (red dashed line).
Current usage metrics show cumulative count of Article Views (full-text article views including HTML views, PDF and ePub downloads, according to the available data) and Abstracts Views on Vision4Press platform.
Data correspond to usage on the plateform after 2015. The current usage metrics is available 48-96 hours after online publication and is updated daily on week days.
Initial download of the metrics may take a while.