Fig. A.2.
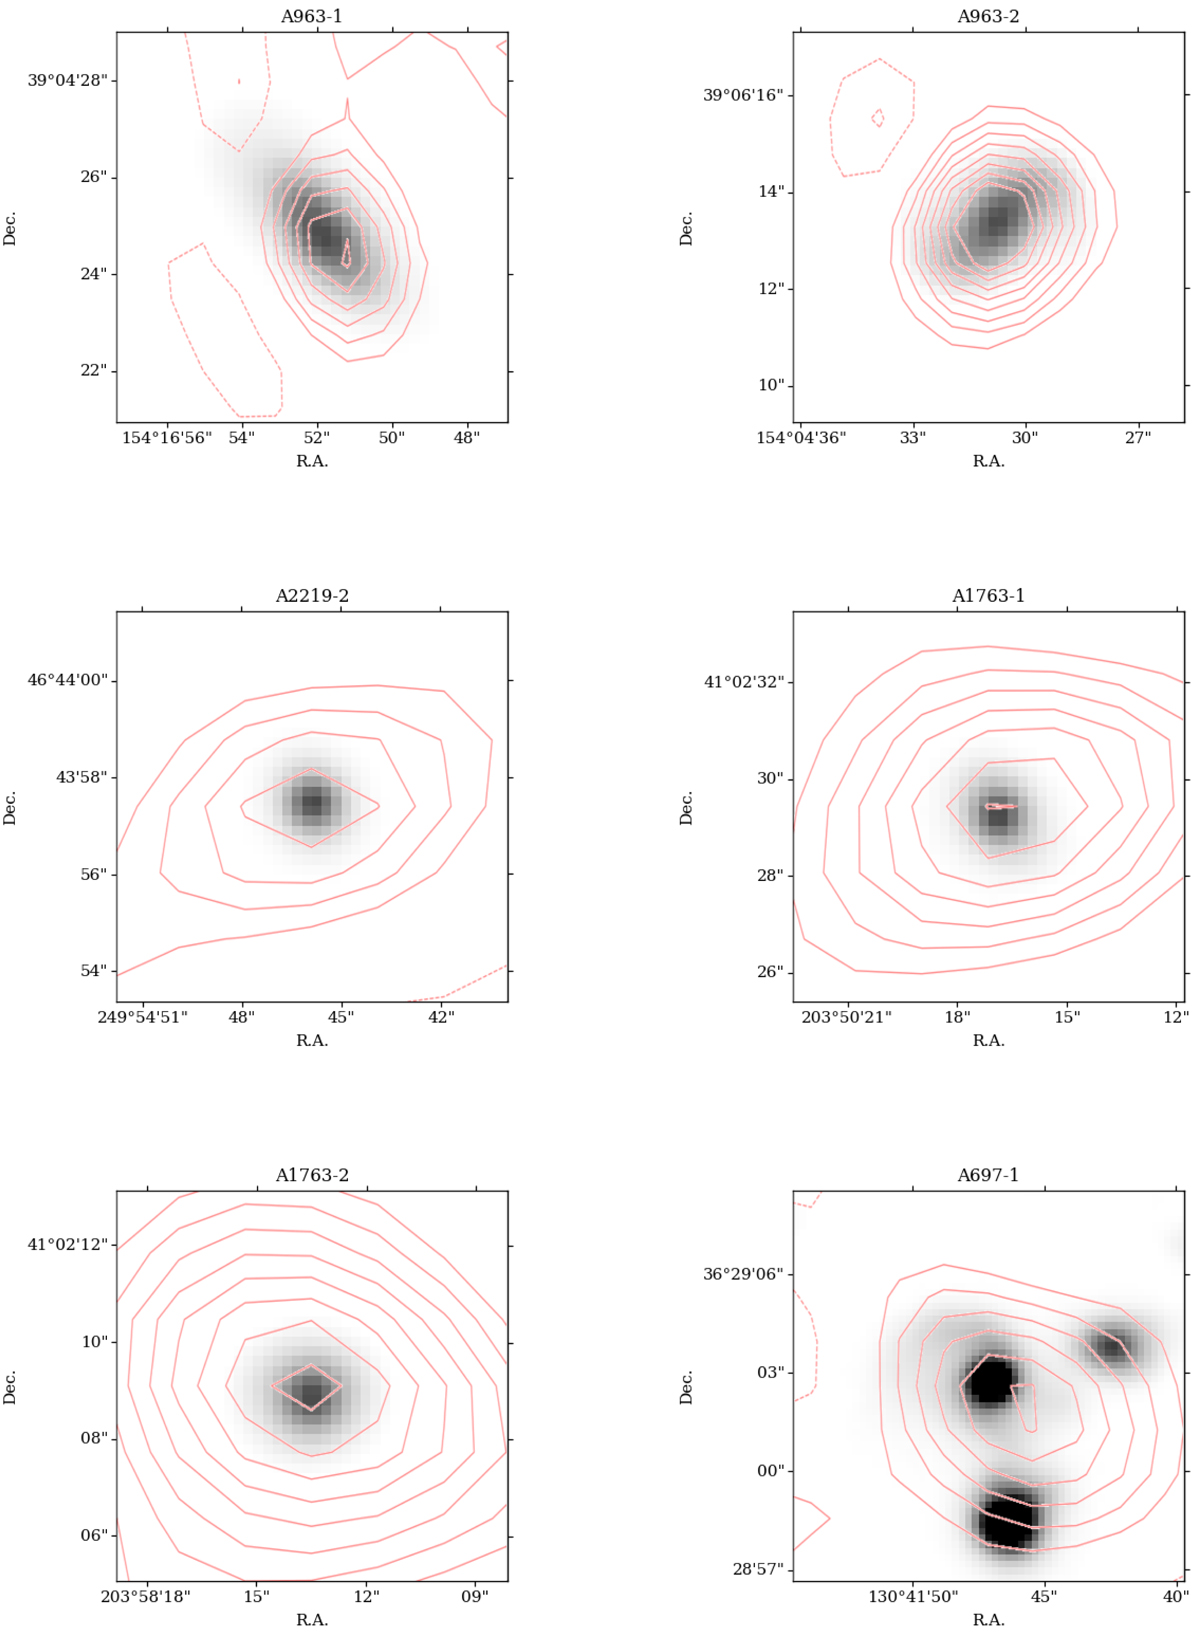
Subaru images (8″ × 8″ size), with the exception of A697-1 (12″ × 12″ size), centered at the coordinates of some of our targets, as shown at the top of each image. The i+-band is considered for all sources except for A963-1 and A963-1, for which the Ic-filter is used. The sources do not have available HST observations and are therefore not reported in Fig. A.1. North is up, east is left. As in Fig. A.3, NOEMA contours are shown in red. Small shifts ≤0.34 arcsec are applied to the images, consistent with the absolute Subaru astrometric uncertainties.
Current usage metrics show cumulative count of Article Views (full-text article views including HTML views, PDF and ePub downloads, according to the available data) and Abstracts Views on Vision4Press platform.
Data correspond to usage on the plateform after 2015. The current usage metrics is available 48-96 hours after online publication and is updated daily on week days.
Initial download of the metrics may take a while.