Fig. C.2
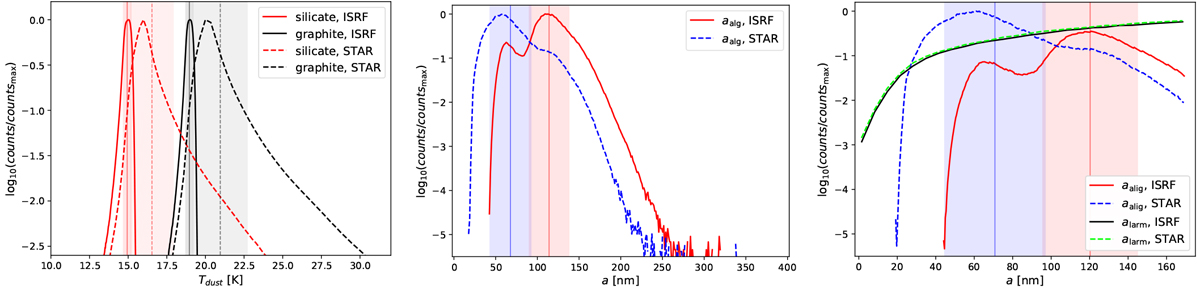
Same as Fig. C.1. Left panel: individual dust temperatures Tdust of silicate and graphite grains for the setups ISRF and STAR, respectively. Center panel: alignment radius aalig for silicate grains. The Larmor limit is not plotted because alarm ≫ 400 nm. Right panel: distribution of the radii aalig and alarm for graphite grains.
Current usage metrics show cumulative count of Article Views (full-text article views including HTML views, PDF and ePub downloads, according to the available data) and Abstracts Views on Vision4Press platform.
Data correspond to usage on the plateform after 2015. The current usage metrics is available 48-96 hours after online publication and is updated daily on week days.
Initial download of the metrics may take a while.