Fig. C.1
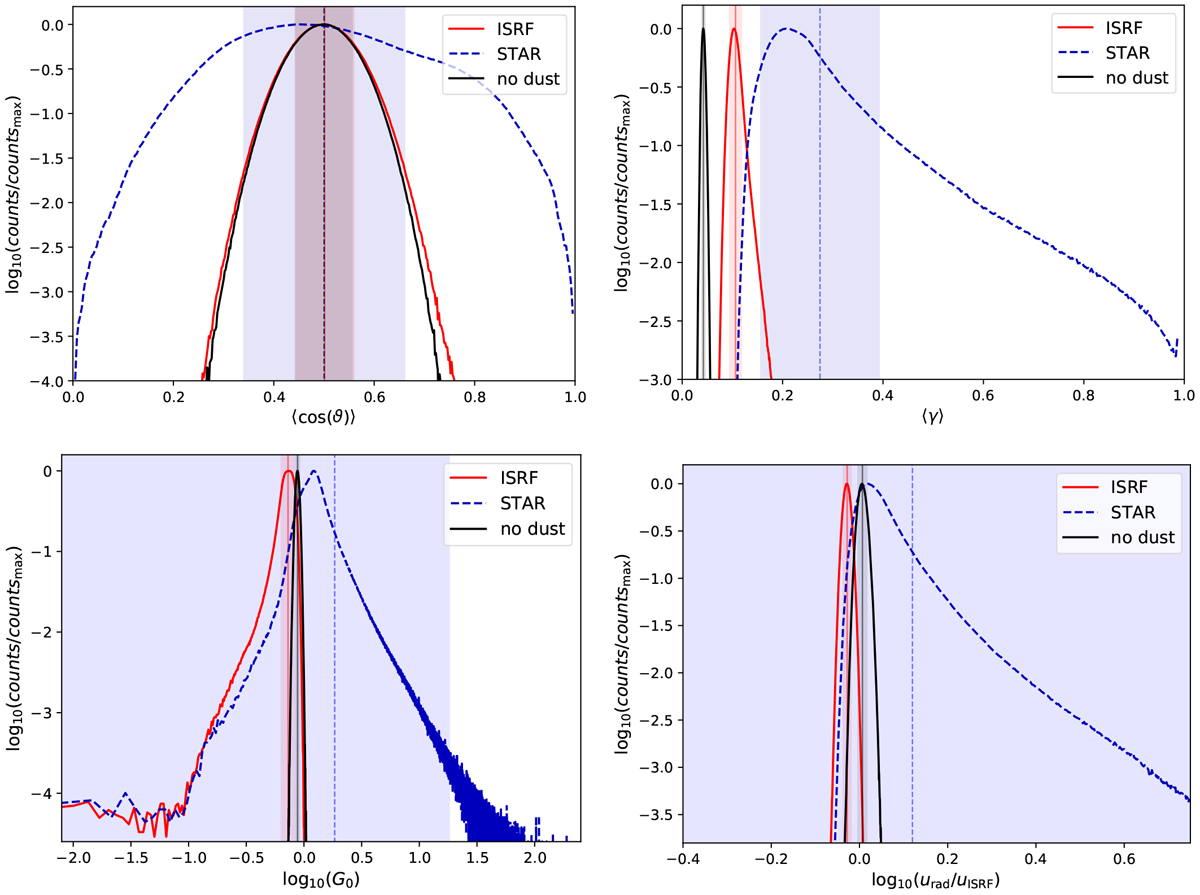
Histograms considering all cells within the RAMSES cube for the setups ISRF and STAR, respectively, as well as a test run with the ISRF and no dust. The individual panels are the average angle
![]() between magnetic field direction and radiation field (upper left) and the anisotropy factor
between magnetic field direction and radiation field (upper left) and the anisotropy factor
![]() (upper right), G0 (bottom left), and the average energy density, urad, of the radiation field (bottom right). All histograms are normalized to their respective peak values. Vertical lines and bars represent the corresponding mean values and the standard deviations, respectively.
(upper right), G0 (bottom left), and the average energy density, urad, of the radiation field (bottom right). All histograms are normalized to their respective peak values. Vertical lines and bars represent the corresponding mean values and the standard deviations, respectively.
Current usage metrics show cumulative count of Article Views (full-text article views including HTML views, PDF and ePub downloads, according to the available data) and Abstracts Views on Vision4Press platform.
Data correspond to usage on the plateform after 2015. The current usage metrics is available 48-96 hours after online publication and is updated daily on week days.
Initial download of the metrics may take a while.