Free Access
Fig. 7.
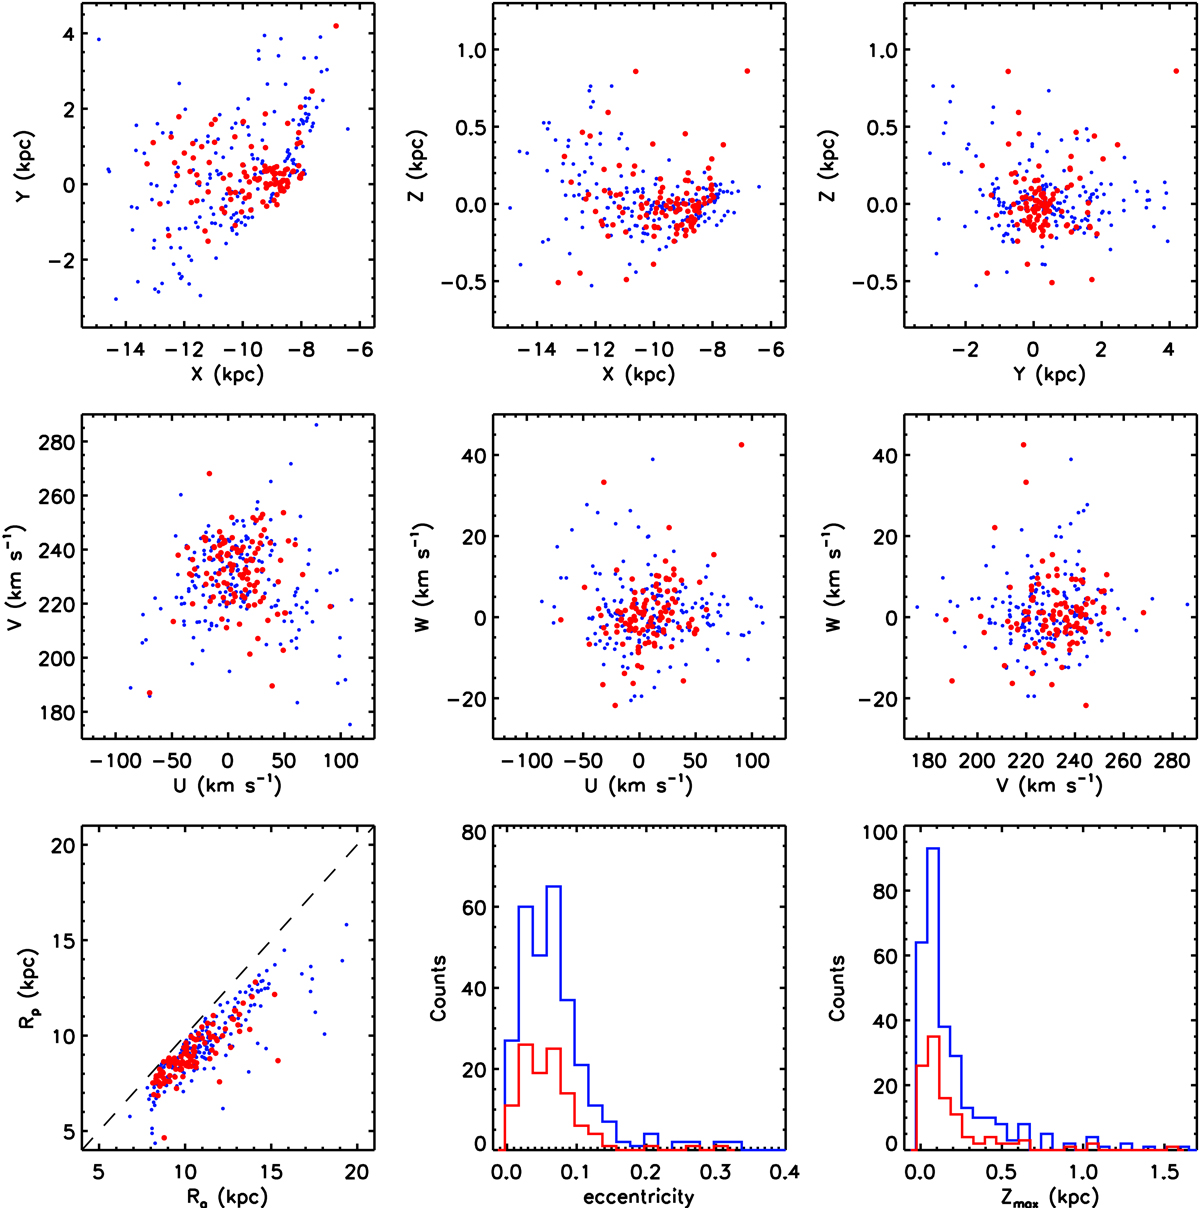
Distribution of derived spatial and kinematic parameters. The blue dots are the 295 OCs with RVs estimations. The red dots are 109 OCs that have RVs measurements with high quality. The distribution of clusters illustrate that they are located on the Galactic plane and have kinematics typical of the thin disk.
Current usage metrics show cumulative count of Article Views (full-text article views including HTML views, PDF and ePub downloads, according to the available data) and Abstracts Views on Vision4Press platform.
Data correspond to usage on the plateform after 2015. The current usage metrics is available 48-96 hours after online publication and is updated daily on week days.
Initial download of the metrics may take a while.