Fig. 6.
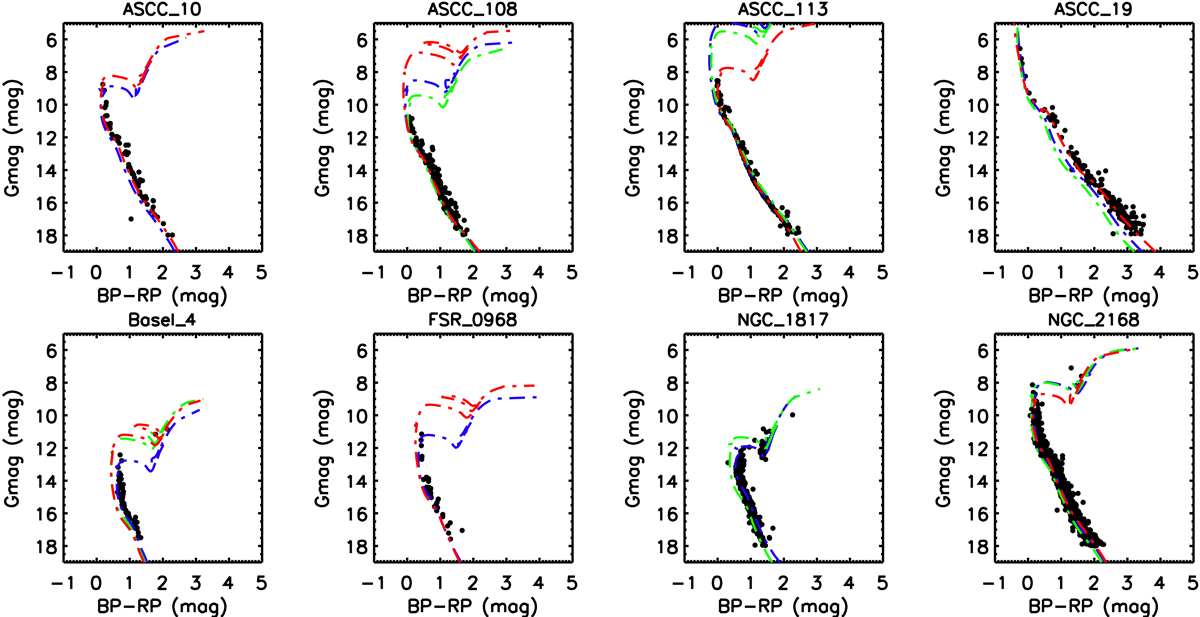
Examples of member distribution in color-magnitude diagram. Colors represent the isochrone parameters provided by different literature sources: Dias et al. (2002) in green, Kharchenko et al. (2012) in blue, and Bossini et al. (2019) in red. The complete list of fitting results is available along with the catalog data (see Sect. 4).
Current usage metrics show cumulative count of Article Views (full-text article views including HTML views, PDF and ePub downloads, according to the available data) and Abstracts Views on Vision4Press platform.
Data correspond to usage on the plateform after 2015. The current usage metrics is available 48-96 hours after online publication and is updated daily on week days.
Initial download of the metrics may take a while.