Free Access
Fig. 10.
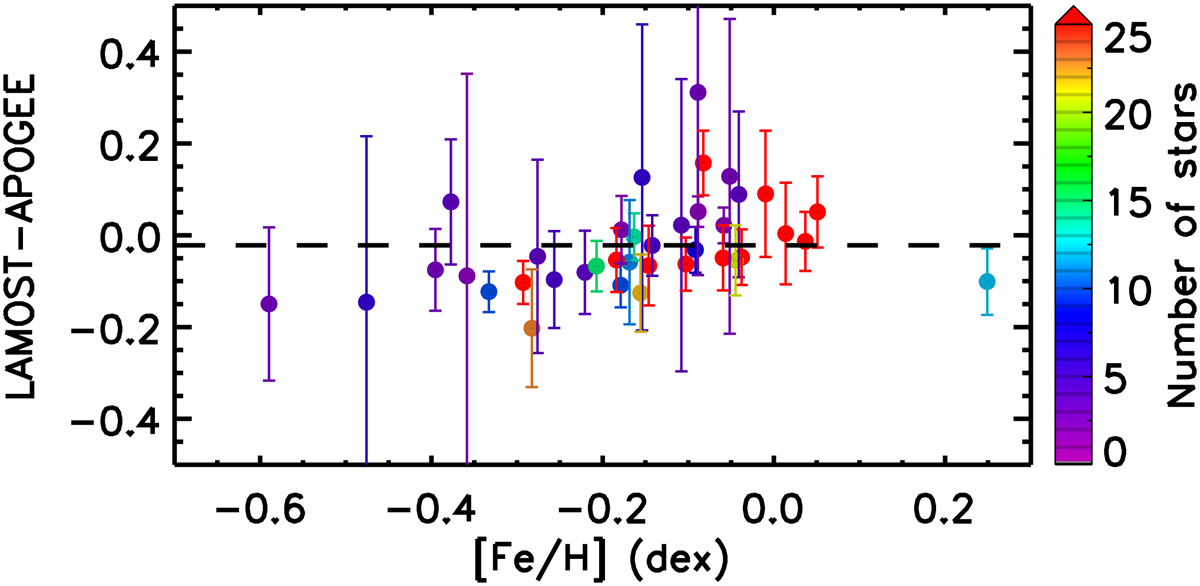
[Fe/H] differences for 38 common clusters between DJ20 and our catalog. The solid circles and their corresponding error bars represent the mean [Fe/H] and dispersion of each cluster in our catalog, respectively. As a comparison result of overall [Fe/H] of OCs, the average difference is −0.02 ± 0.10 dex.
Current usage metrics show cumulative count of Article Views (full-text article views including HTML views, PDF and ePub downloads, according to the available data) and Abstracts Views on Vision4Press platform.
Data correspond to usage on the plateform after 2015. The current usage metrics is available 48-96 hours after online publication and is updated daily on week days.
Initial download of the metrics may take a while.