Fig. 9.
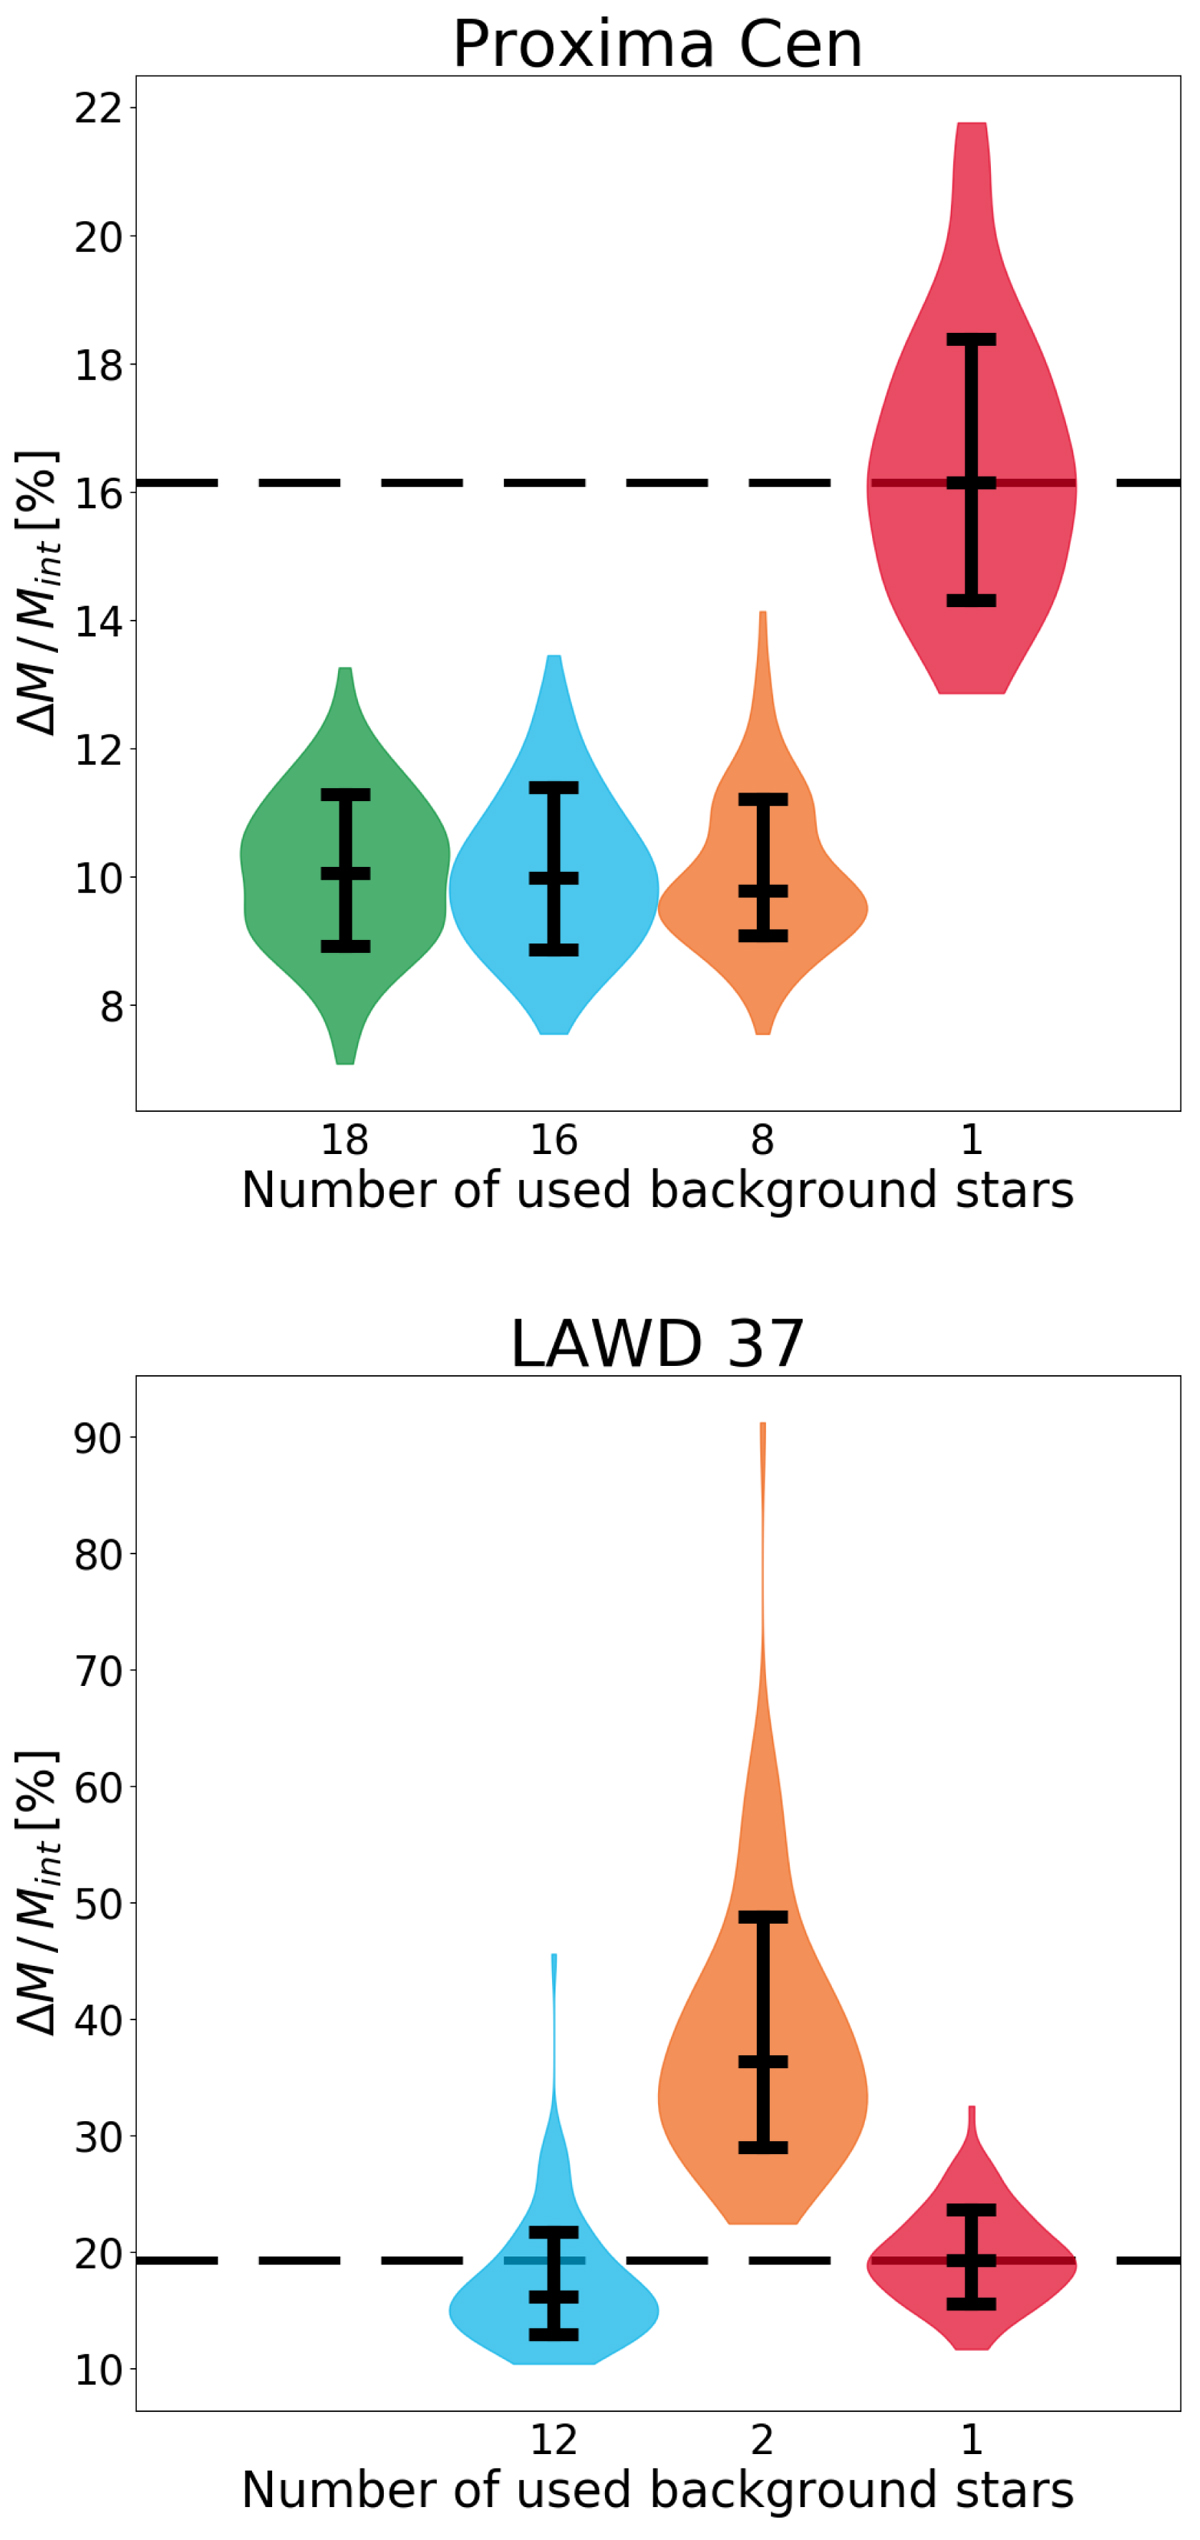
Violin plot of the achievable uncertainties for the four different methods for Proxima Centauri (top) and LAWD 37 (bottom). For each method the 16th, 50th, and 84th, percentile are shown. The shape shows the distribution of the 100 determined uncertainties caused by varying the input parameter. This distribution is smoothed with a Gaussian kernel. The green “violins” use all of the background sources. For the blue violins only background sources with a five-parameter solution are used, and for the orange violins only stars with a precision in the along-scan direction better than 0.5 mas and a five-parameter solution are used. The red violins show the best results when only one source is used. The dashed line indicates the median of this distribution. For each method the number of used stars is listed below the violin. The missing green violin of LAWD 37 is caused by no additional background stars with a two-parameter solution only. Hence it would be identical to the blue one (For the other events with multiple background stars see Fig. A.1).
Current usage metrics show cumulative count of Article Views (full-text article views including HTML views, PDF and ePub downloads, according to the available data) and Abstracts Views on Vision4Press platform.
Data correspond to usage on the plateform after 2015. The current usage metrics is available 48-96 hours after online publication and is updated daily on week days.
Initial download of the metrics may take a while.