Fig. 7.
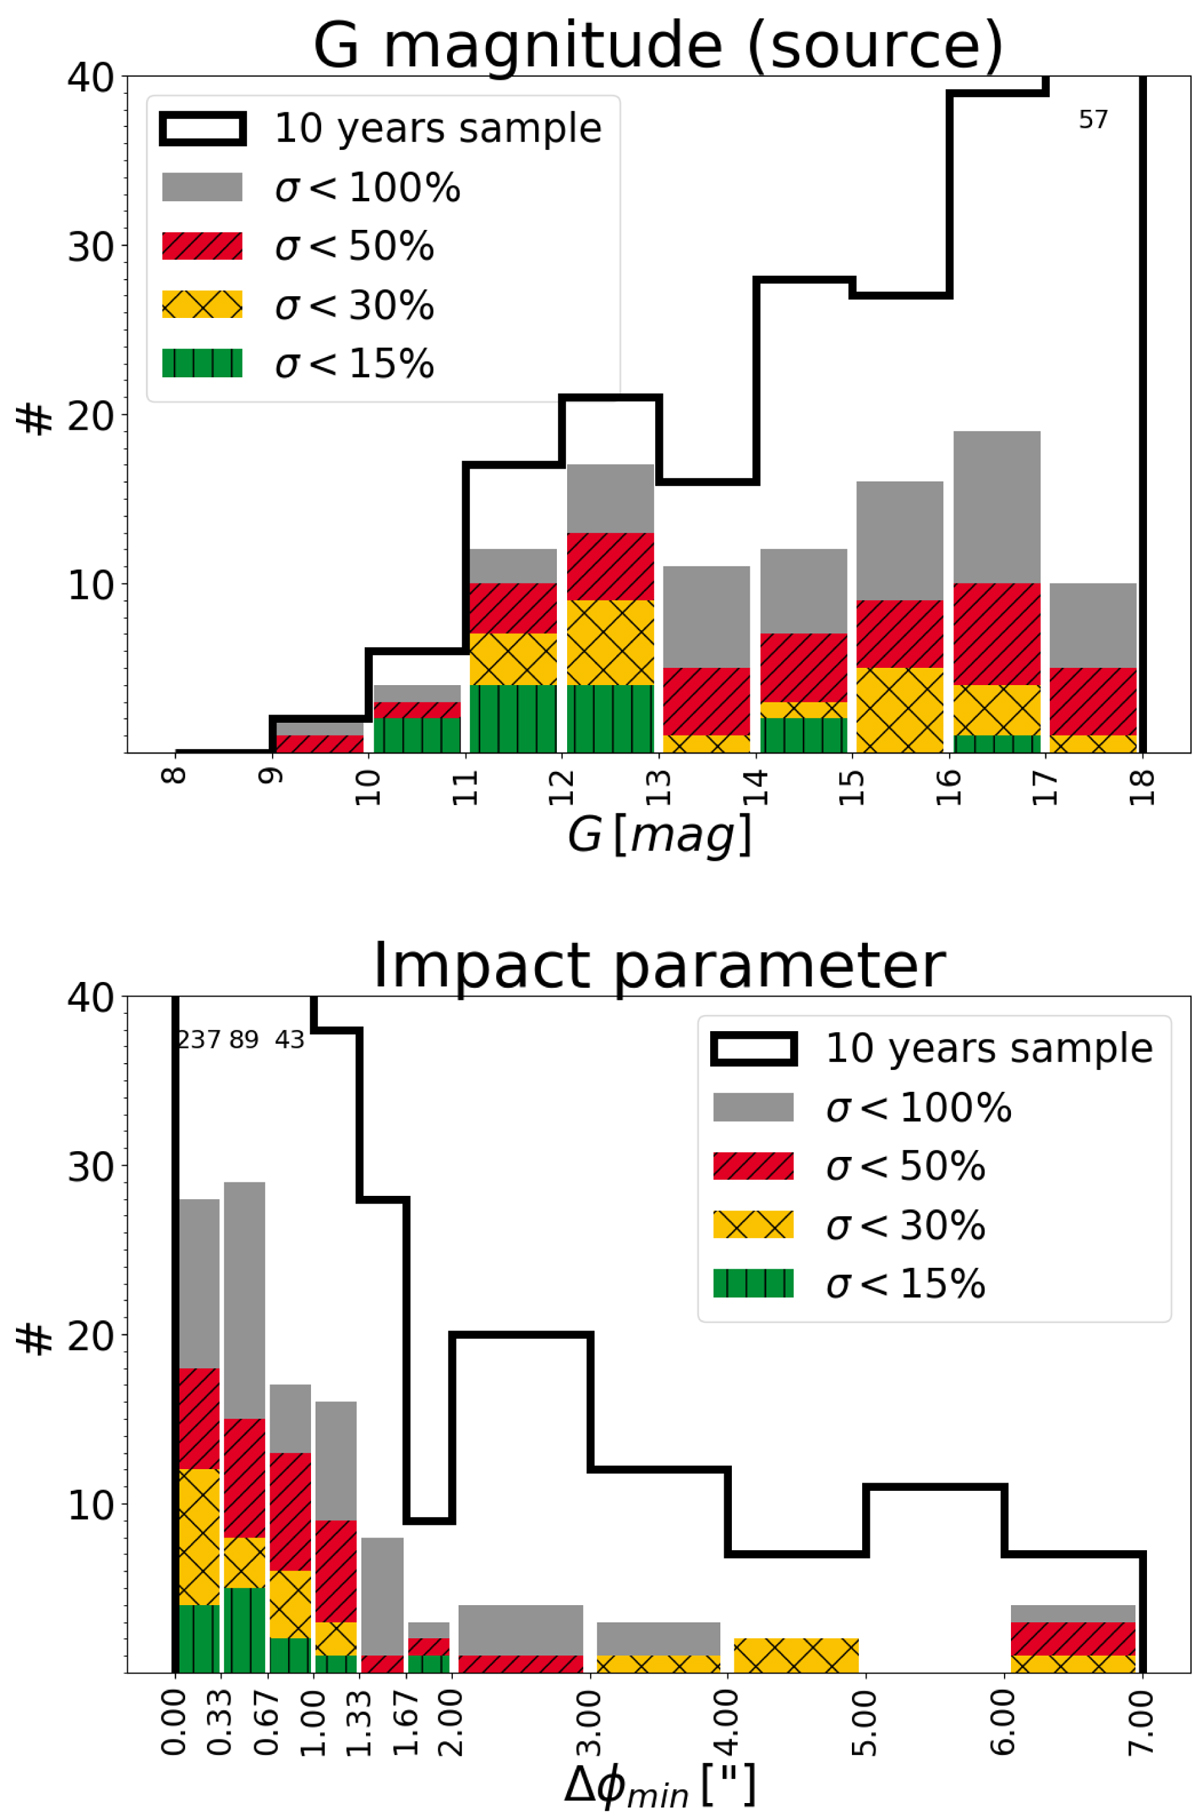
Distribution of the G magnitude of the source (top) and impact parameter (bottom) as well as the resulting relative standard error of the mass determination for the investigated events. The grey, red, yellow, and green parts correspond to a relative standard error better than 100%, 50%, 30%, and 15%, respectively. The thick black line shows the distribution of the input sample, where the numbers at the top show the number of events in the corresponding bins. The thin black line in the bottom panel shows the events during the nominal mission. We note the different bin width of 0.33″ below ϕmin = 2″ and 1″ above ϕmin = 2″ in the bottom panel.
Current usage metrics show cumulative count of Article Views (full-text article views including HTML views, PDF and ePub downloads, according to the available data) and Abstracts Views on Vision4Press platform.
Data correspond to usage on the plateform after 2015. The current usage metrics is available 48-96 hours after online publication and is updated daily on week days.
Initial download of the metrics may take a while.