Fig. 5.
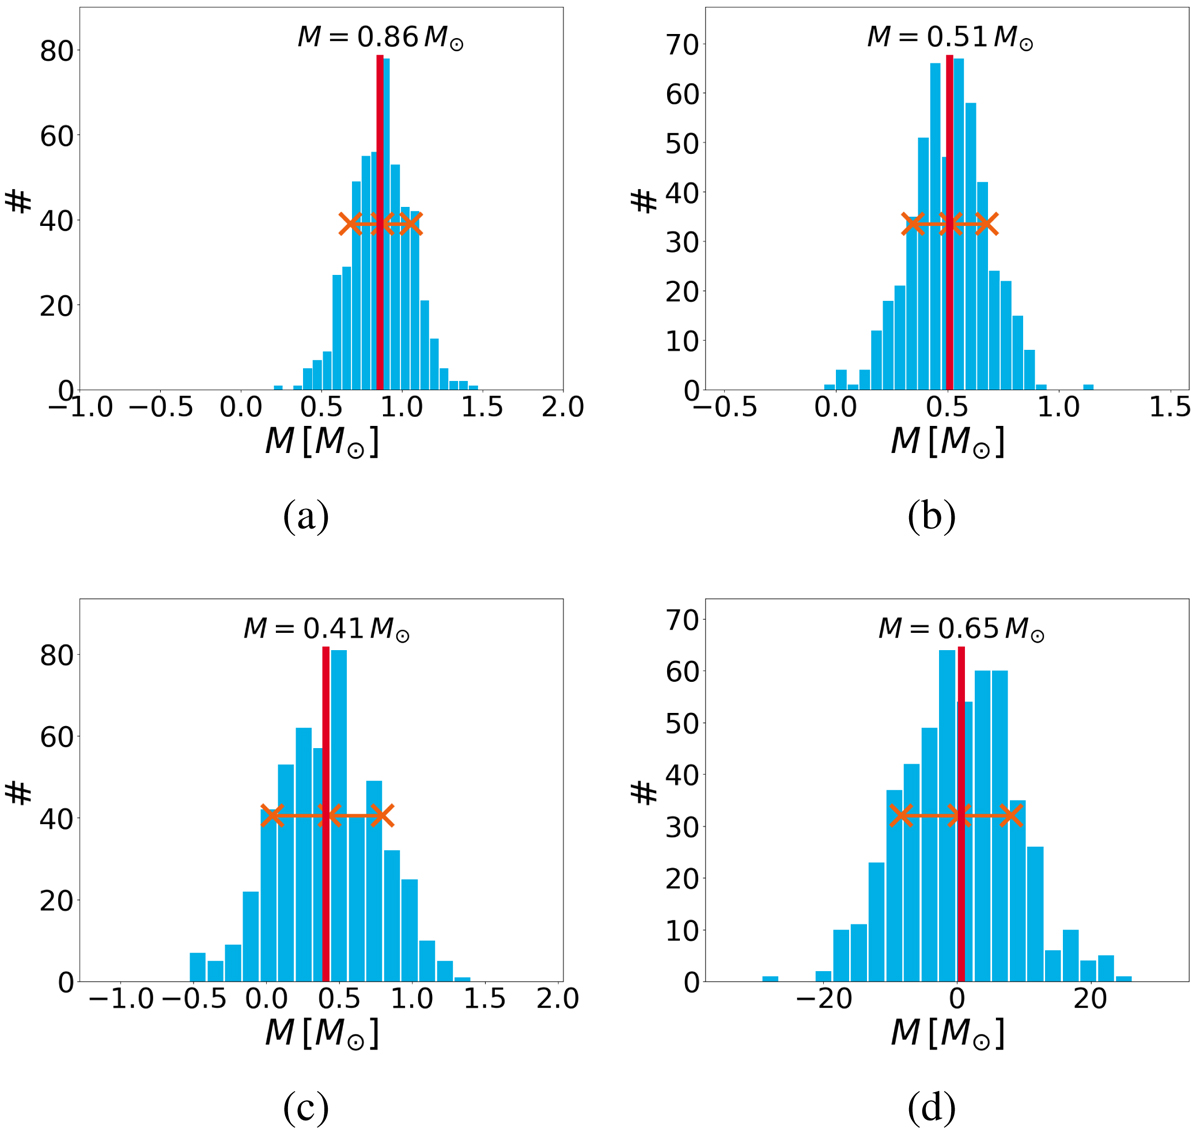
Histogram of the simulated mass determination for four different cases. Panels a and b: precision of about 15% and 30%, respectively; Gaia is able to measure the mass of the lens. Panel c: precision between 50% and 100%; for these events Gaia can detect a deflection, but a good mass determination is not possible. Panel d: the scatter is larger than the mass of the lens; Gaia is not able to detect a deflection of the background source. The orange crosses show the 15.8th, 50th, and 84.2nd percentiles (1σ confidence interval) of the 500 realisations, and the red vertical line indicates the input mass. The much wider x-scale for case (d) is notable.
Current usage metrics show cumulative count of Article Views (full-text article views including HTML views, PDF and ePub downloads, according to the available data) and Abstracts Views on Vision4Press platform.
Data correspond to usage on the plateform after 2015. The current usage metrics is available 48-96 hours after online publication and is updated daily on week days.
Initial download of the metrics may take a while.