Fig. 3.
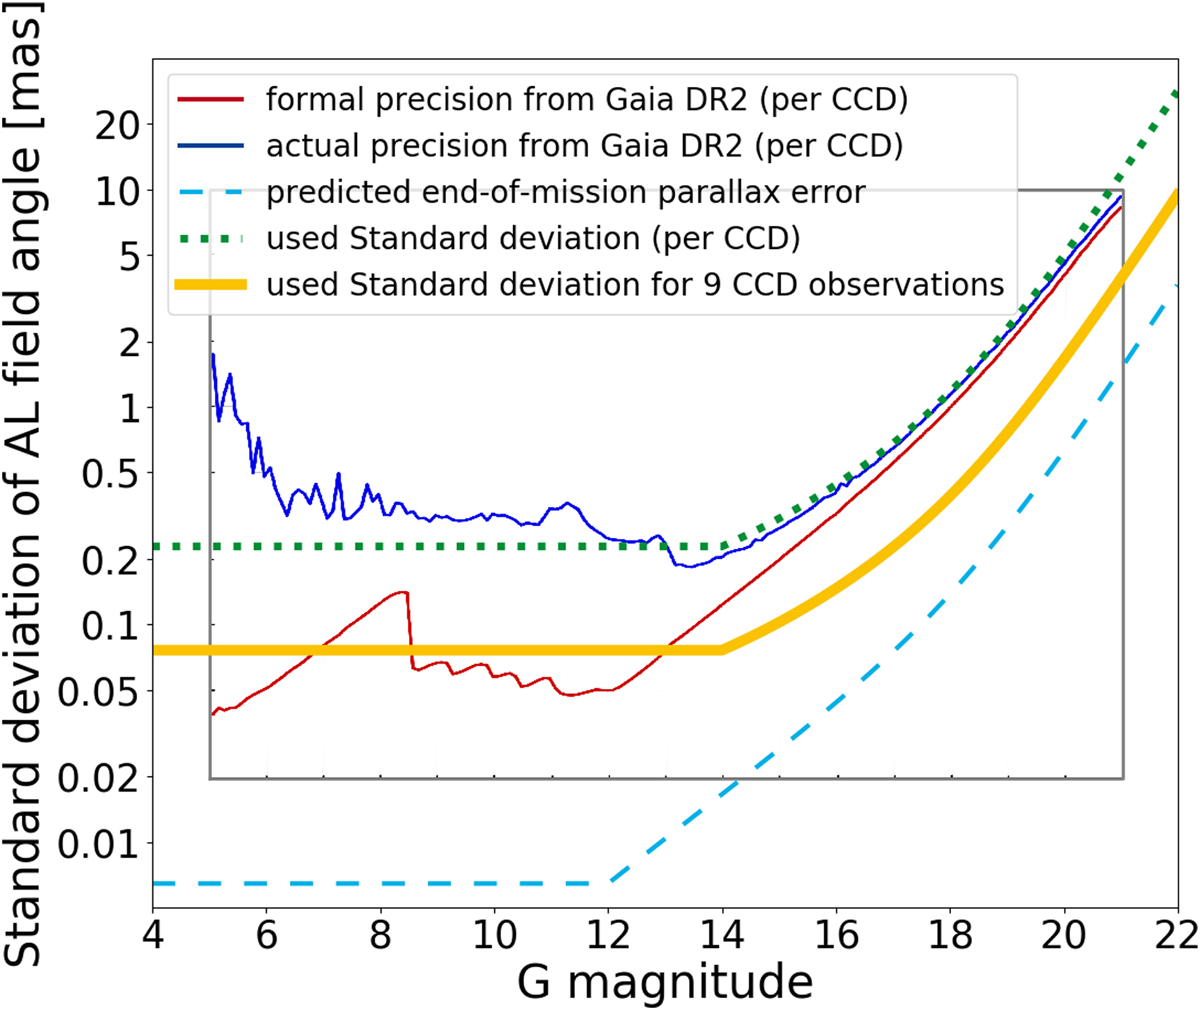
Precision in along-scan direction as function of G magnitude. The red line indicates the expected formal precision from Gaia DR2 for one CCD observation. The blue solid line is the actually achieved precision (Lindegren et al. 2018). The light blue dashed line shows the relation for the end-of-mission parallax error (Gaia Collaboration 2016), and the green dotted line shows the adopted relation for the precision per CCD observation for the present study. The adopted precision for nine CDD observations is shown as a thick yellow curve. The inlay (red and blue curve) is taken from Lindegren et al. (2018), Fig. 9.
Current usage metrics show cumulative count of Article Views (full-text article views including HTML views, PDF and ePub downloads, according to the available data) and Abstracts Views on Vision4Press platform.
Data correspond to usage on the plateform after 2015. The current usage metrics is available 48-96 hours after online publication and is updated daily on week days.
Initial download of the metrics may take a while.