Fig. 9
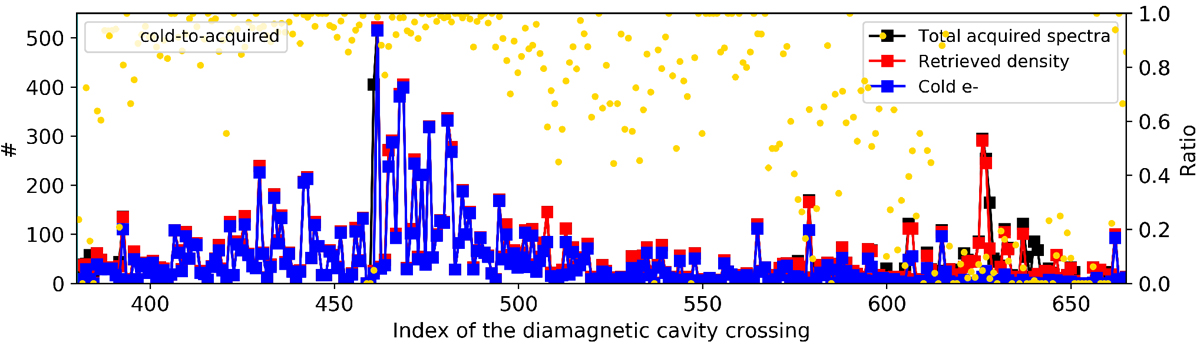
Count of cold electron detections by RPC-MIP (line of blue squares), count of electron density derivation (line of red squares) and count of acquired mutual impedance spectra (line of black squares) for each diamagnetic cavity crossing when RPC-MIP operated in phased SDL sub-mode. The ratio of RPC-MIP cold electron detections with the total acquired mutual impedance spectra is shown in yellow points.
Current usage metrics show cumulative count of Article Views (full-text article views including HTML views, PDF and ePub downloads, according to the available data) and Abstracts Views on Vision4Press platform.
Data correspond to usage on the plateform after 2015. The current usage metrics is available 48-96 hours after online publication and is updated daily on week days.
Initial download of the metrics may take a while.