Fig. 5
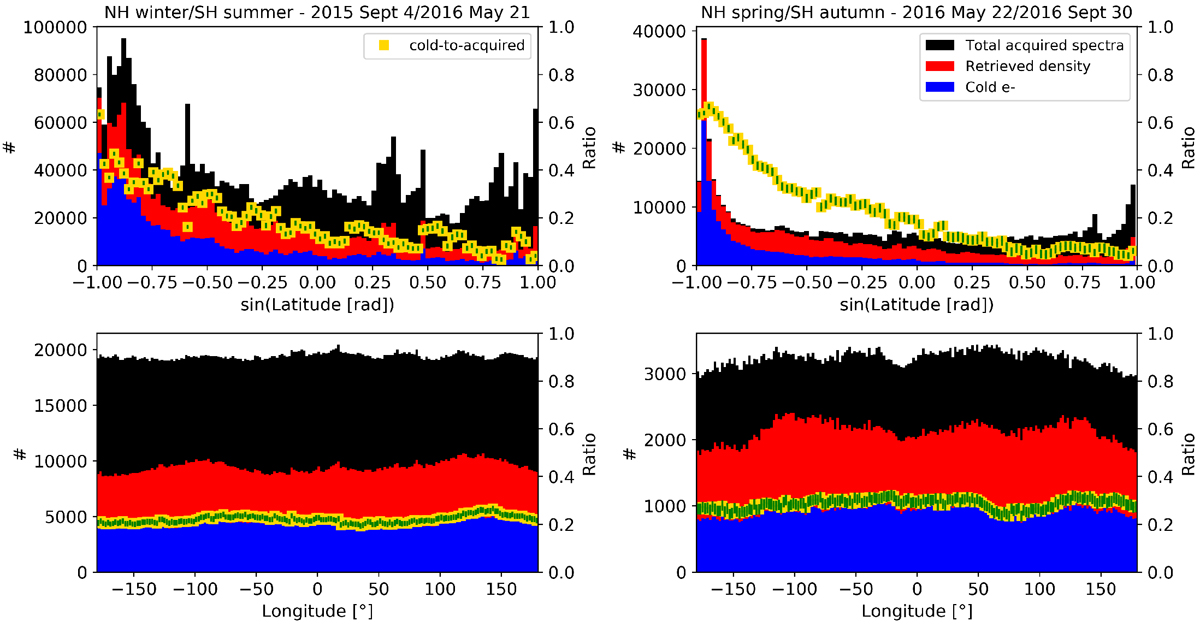
Histograms of the count of RPC-MIP cold electron signatures (blue bars), the count of derived RPC-MIP electron densities (red bars) and the total count of mutual impedance spectra acquired in the phased SDL sub-mode (black bars) compared to the sine of the latitude (top panels) and the longitude expressed in degrees (bottom panels). The cold-to-acquired ratio is shown in yellow squares. Left panels: from 2015 Sept. 4 to 2016 May 21 corresponding to the southern (resp. northern) hemisphere in summer (resp. winter). Right panels: from 2016 May 22 to 2016 Sept. 2016 corresponding to the southern (resp. northern) hemisphere in autumn (resp. spring).
Current usage metrics show cumulative count of Article Views (full-text article views including HTML views, PDF and ePub downloads, according to the available data) and Abstracts Views on Vision4Press platform.
Data correspond to usage on the plateform after 2015. The current usage metrics is available 48-96 hours after online publication and is updated daily on week days.
Initial download of the metrics may take a while.