Fig. 11
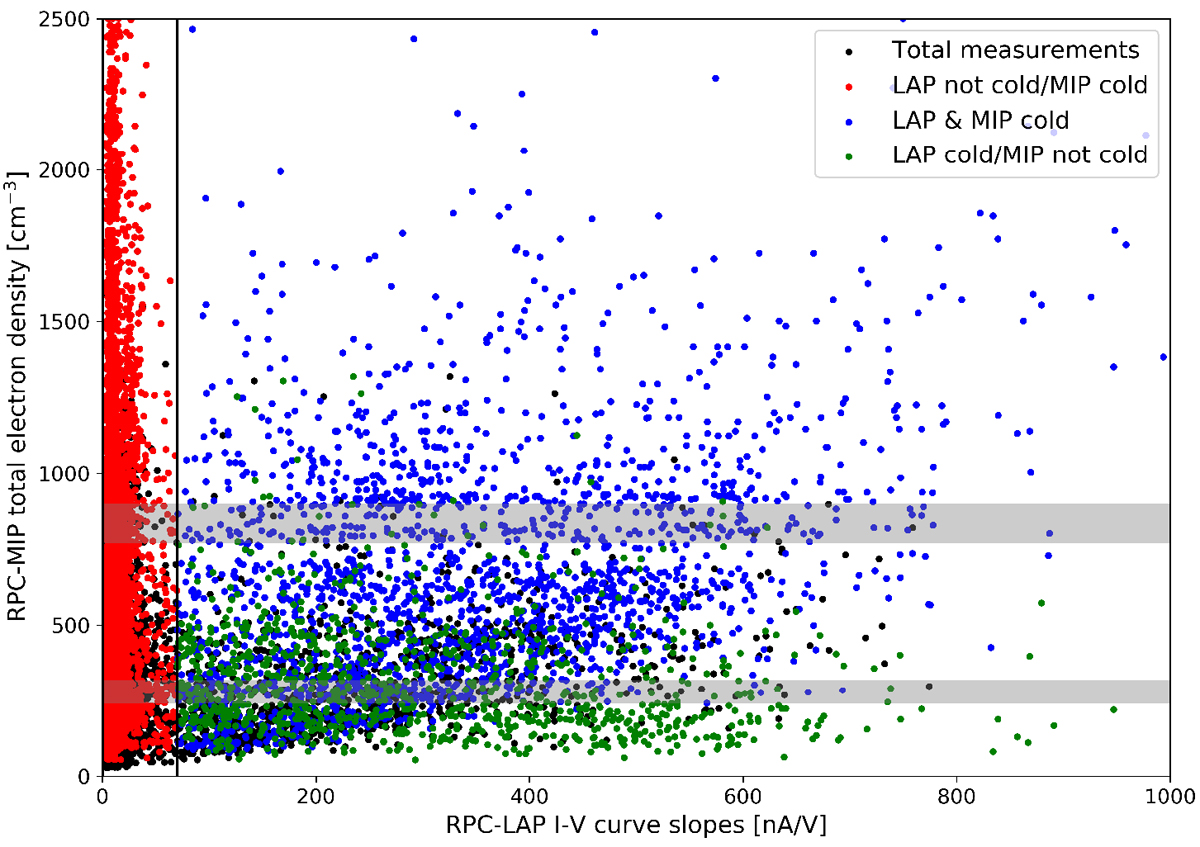
Scatter plot of all simultaneous measurements (RPC-MIP and RPC-LAP measurements where made within 1 sec, considering only RPC-MIP phased SDL sub-mode) showing RPC-MIP total electron density, expressed in cm−3 versus the RPC-LAP I-V curve slope, expressed in nA/V. Measurements are subdivided in three cases: RPC-LAP and RPC-MIP both observed cold electrons (blue points), RPC-LAP observed cold electrons while RPC-MIP did not (green points) and RPC-MIP observed cold electrons while RPC-LAP did not (red points). The grey horizontal bars indicate the electron density corresponding to the well-known RPC-MIP interferences (see Sect. 2.2).
Current usage metrics show cumulative count of Article Views (full-text article views including HTML views, PDF and ePub downloads, according to the available data) and Abstracts Views on Vision4Press platform.
Data correspond to usage on the plateform after 2015. The current usage metrics is available 48-96 hours after online publication and is updated daily on week days.
Initial download of the metrics may take a while.