Fig. 1.
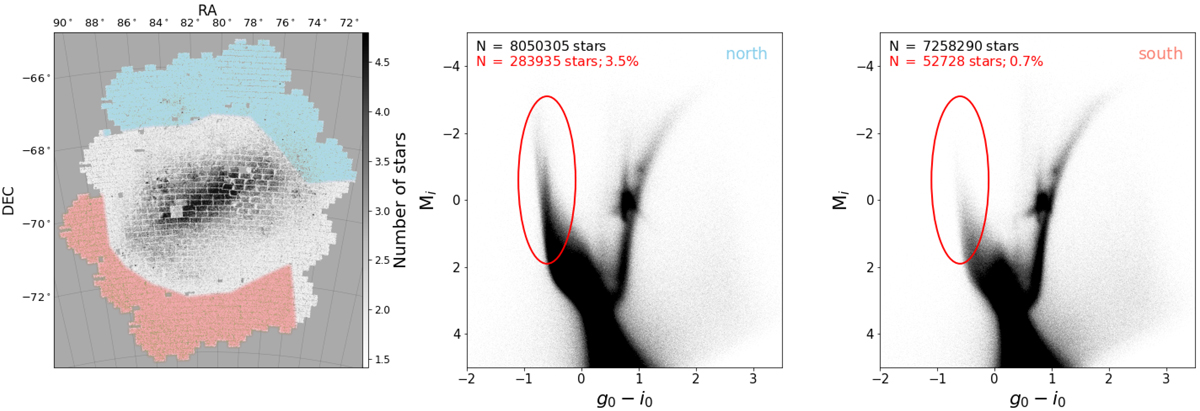
Stellar spatial distribution and observed colour-magnitude diagrams corresponding to two visually selected regions representative of the northwest (blue) and southeast (red) regions of the LMC. Left: LMC-reconstructed stellar density image from SMASH data showing the number density of stars brighter than Mi = −1. North is up, east is left. Middle: northwest region, roughly corresponding with the arm. Right: southeast region. We note the clear differences in the bright, blue main sequence (approximately delimited by the red ellipse), indicating the presence of a prominent young stellar population in the arm region (∼3.5% of the 8 million stars sampled against the only ∼0.7% of 7.3 million stars in the south region).
Current usage metrics show cumulative count of Article Views (full-text article views including HTML views, PDF and ePub downloads, according to the available data) and Abstracts Views on Vision4Press platform.
Data correspond to usage on the plateform after 2015. The current usage metrics is available 48-96 hours after online publication and is updated daily on week days.
Initial download of the metrics may take a while.