Free Access
Fig. 4.
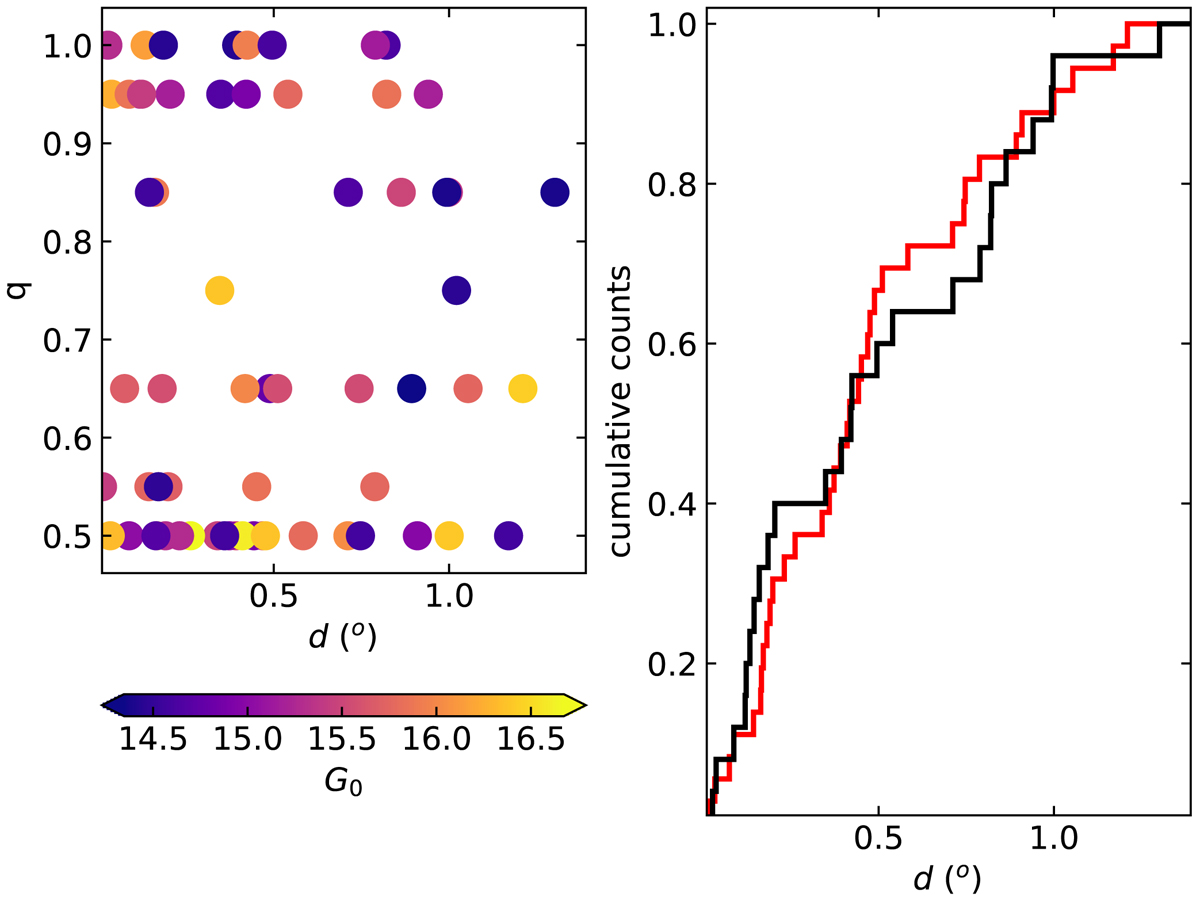
q values associated with the cluster binary stars as a function of d, color-coded according to their intrinsic G0 magnitudes (left panel). The cumulative distribution for binary stars with q values lower or higher than 0.75 are depicted with a red and black line, respectively (right panel).
Current usage metrics show cumulative count of Article Views (full-text article views including HTML views, PDF and ePub downloads, according to the available data) and Abstracts Views on Vision4Press platform.
Data correspond to usage on the plateform after 2015. The current usage metrics is available 48-96 hours after online publication and is updated daily on week days.
Initial download of the metrics may take a while.