Free Access
Fig. 3.
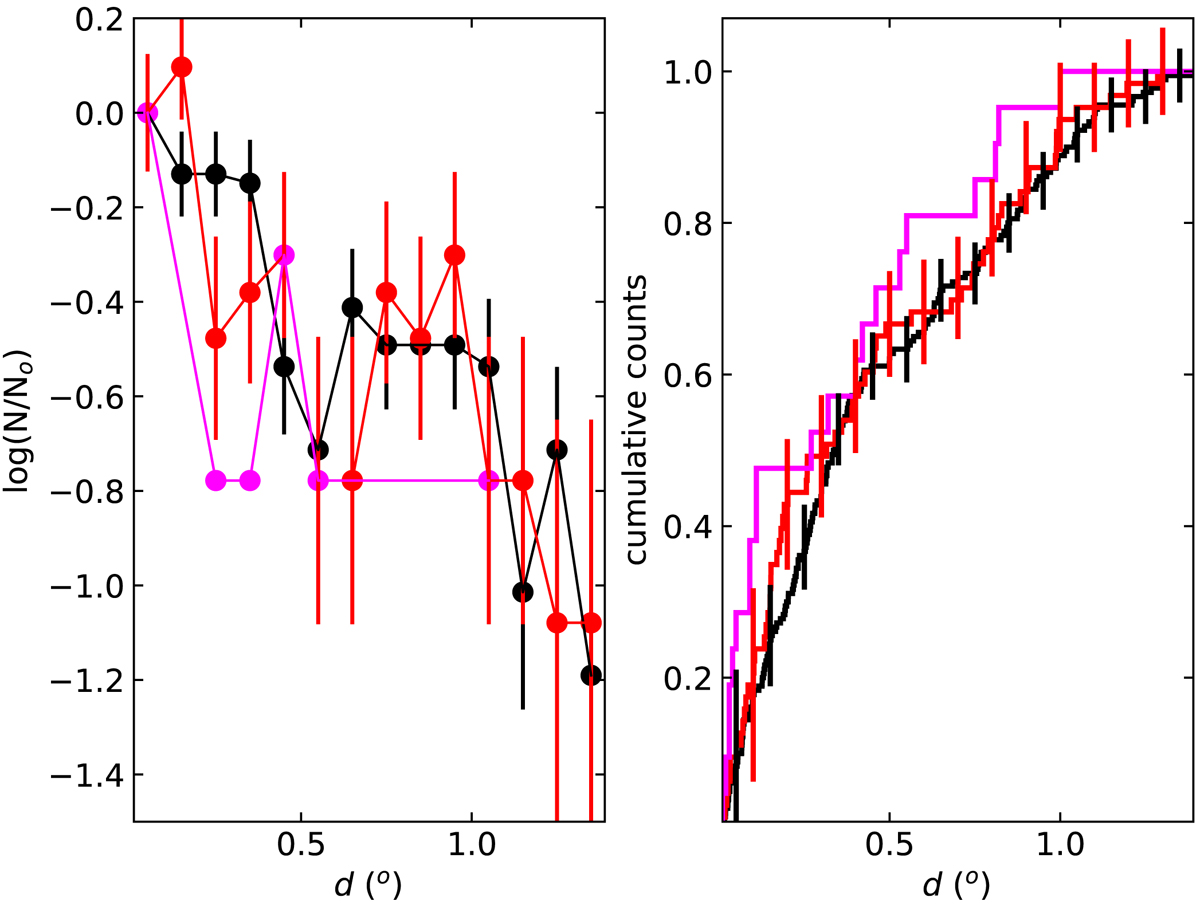
Observed radial density profiles (left panel) and cumulative distribution functions (right panel) for cluster MS (black lines), binary (red lines), and red giant stars (magenta lines). Error bars are also indicated.
Current usage metrics show cumulative count of Article Views (full-text article views including HTML views, PDF and ePub downloads, according to the available data) and Abstracts Views on Vision4Press platform.
Data correspond to usage on the plateform after 2015. The current usage metrics is available 48-96 hours after online publication and is updated daily on week days.
Initial download of the metrics may take a while.