Free Access
Fig. 1.
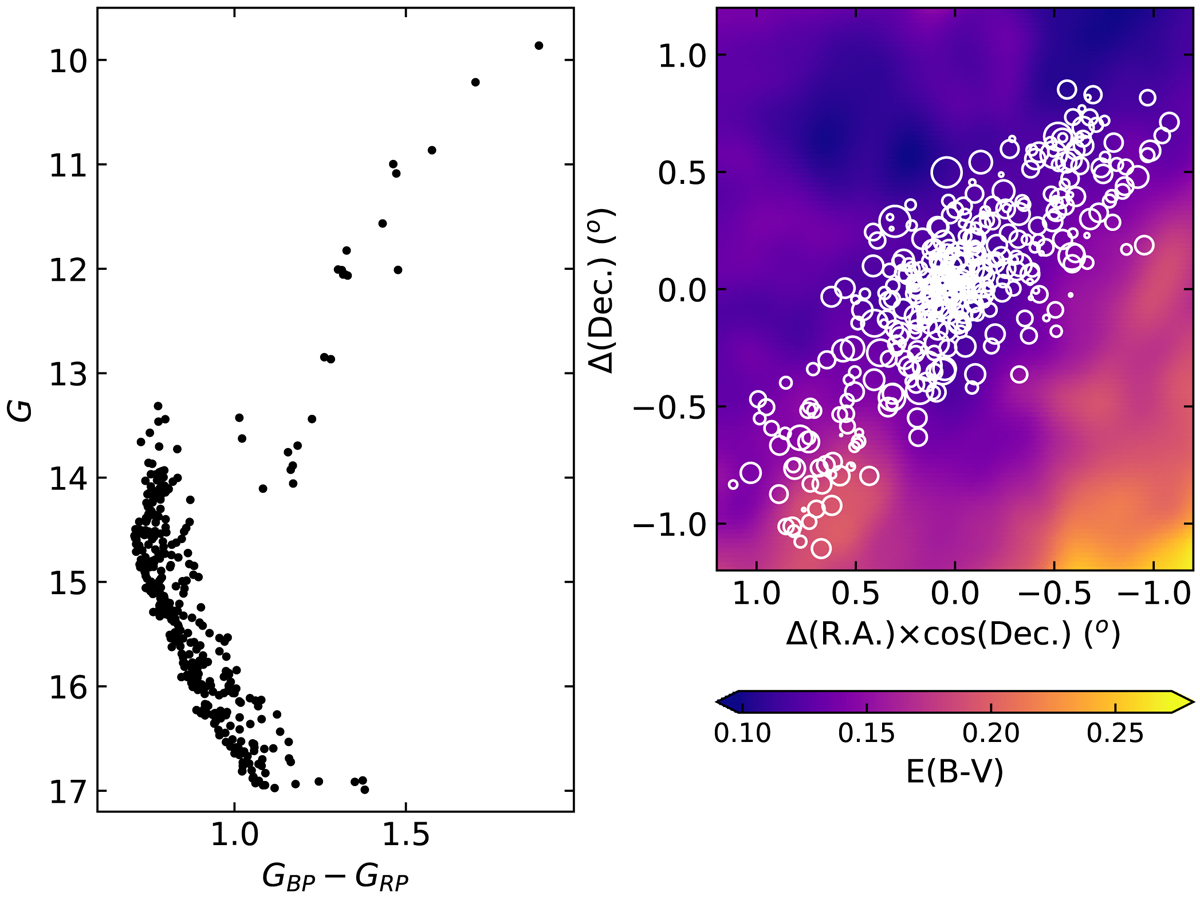
Observed cluster CMD (left panel). Interstellar reddening (E(B − V)) map for the cluster field (right panel). The cluster members are represented by open circles whose sizes are proportional to their G brightnesses.
Current usage metrics show cumulative count of Article Views (full-text article views including HTML views, PDF and ePub downloads, according to the available data) and Abstracts Views on Vision4Press platform.
Data correspond to usage on the plateform after 2015. The current usage metrics is available 48-96 hours after online publication and is updated daily on week days.
Initial download of the metrics may take a while.