Fig. 7.
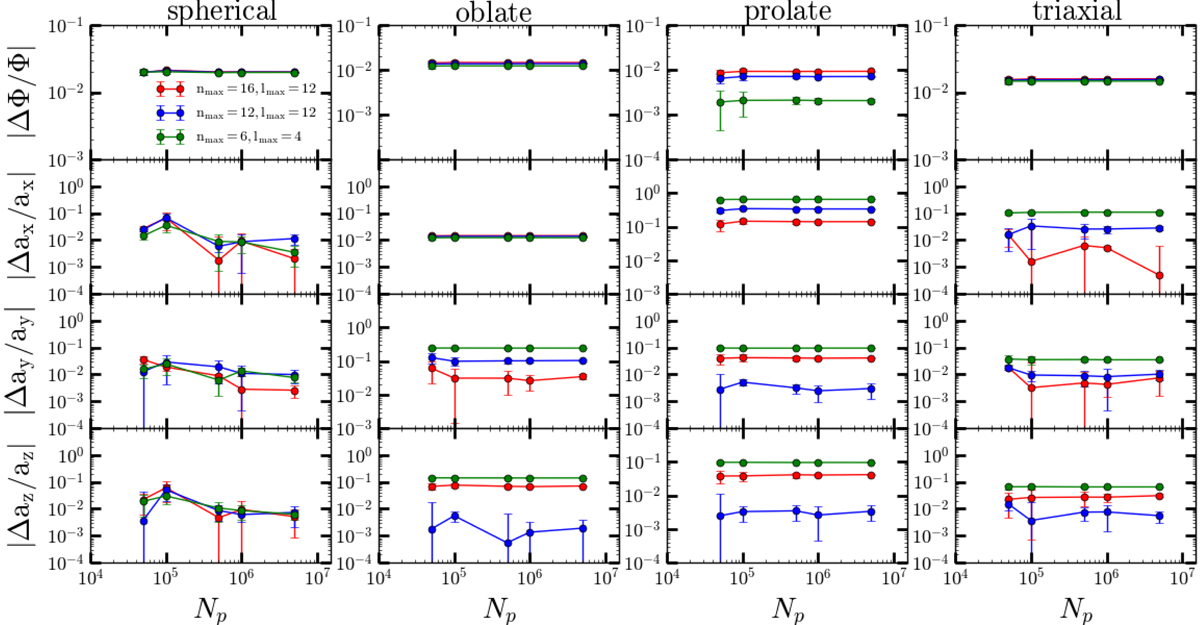
Relative errors of the potential and forces for the Hernquist models with different particle numbers at r = 0.01 when using the HO method. In each panel, the red, blue, and green lines are the results for HO method with (nmax, lmax) = (16,12), (12,12), and (6,4), respectively. The filled circles are the mean value from 40 random samples, and the error bar is the standard error from these samples.
Current usage metrics show cumulative count of Article Views (full-text article views including HTML views, PDF and ePub downloads, according to the available data) and Abstracts Views on Vision4Press platform.
Data correspond to usage on the plateform after 2015. The current usage metrics is available 48-96 hours after online publication and is updated daily on week days.
Initial download of the metrics may take a while.