Fig. 6.
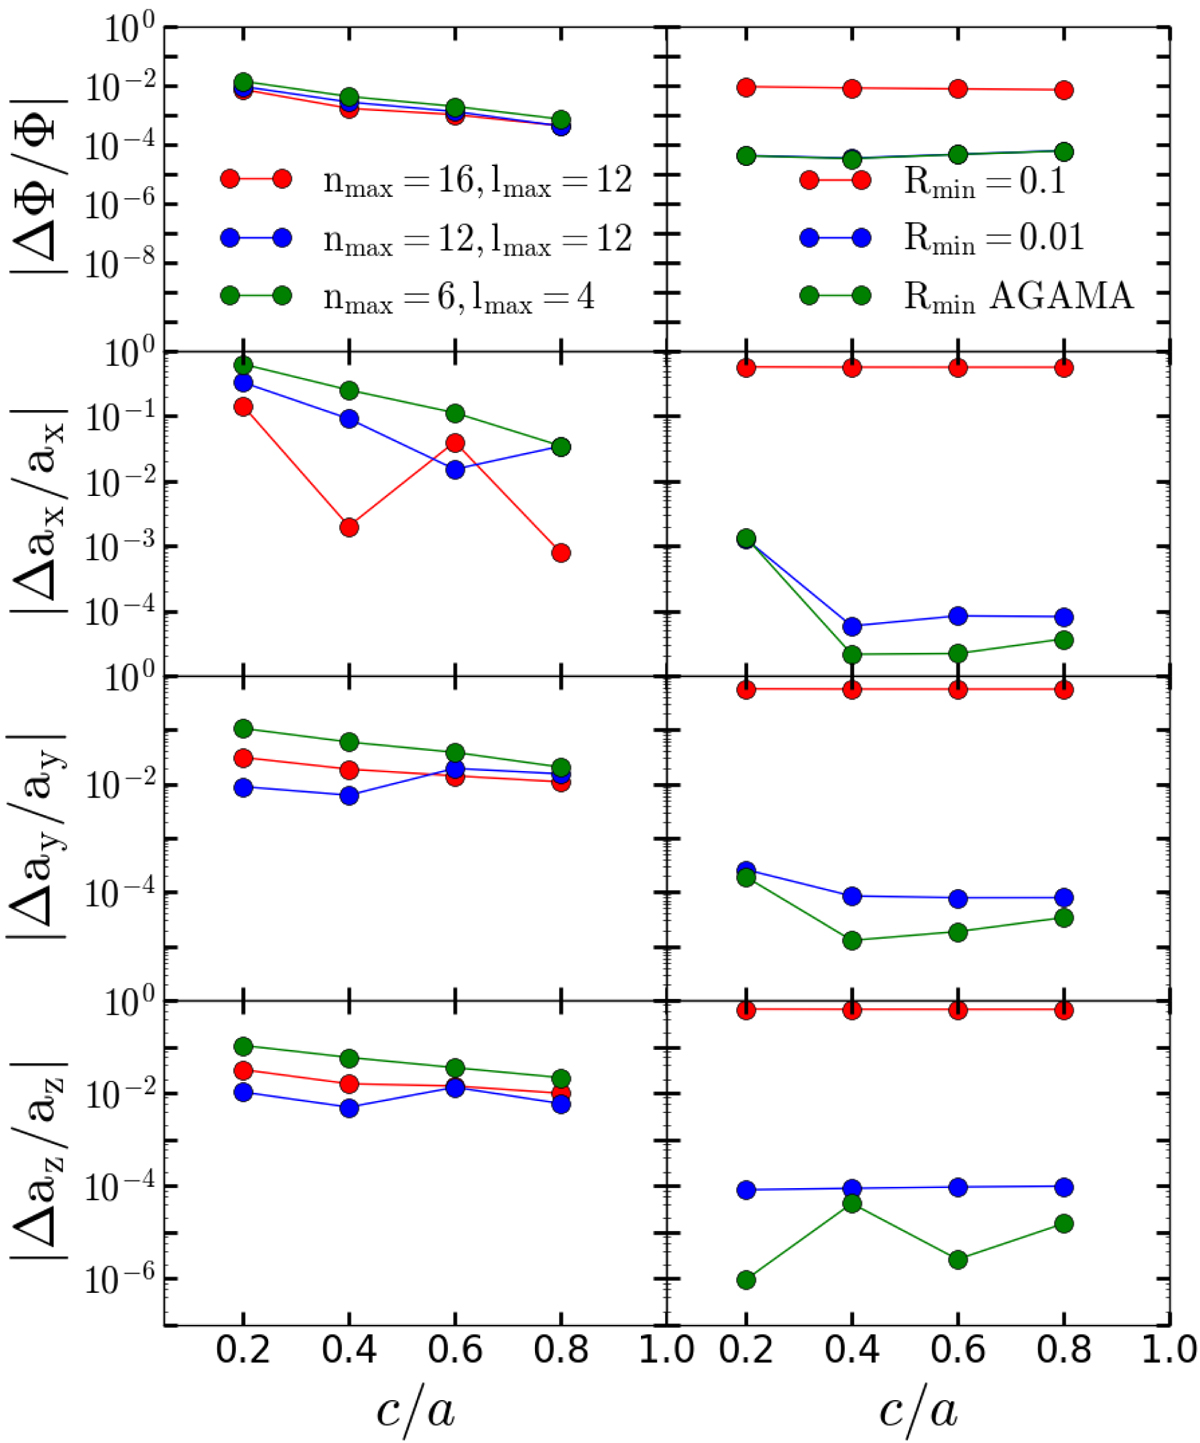
Relative error in potential and forces for both the HO (left) and the CylSP methods (right) for the prolate models with a different c/a at r = 0.01. Left panels: the red, blue, and green lines are the results for the HO method with (nmax, lmax) = (16,12), (12,12), and (6,4), respectively. Right panels: the red, blue, and green lines represent the results for the CylSP method with Rmin = 0.1, 0.01, and the value given by AGAMA, respectively. From top to bottom: the radius r is along the x-, x-, y-, and z-axes, respectively.
Current usage metrics show cumulative count of Article Views (full-text article views including HTML views, PDF and ePub downloads, according to the available data) and Abstracts Views on Vision4Press platform.
Data correspond to usage on the plateform after 2015. The current usage metrics is available 48-96 hours after online publication and is updated daily on week days.
Initial download of the metrics may take a while.