Fig. 2.
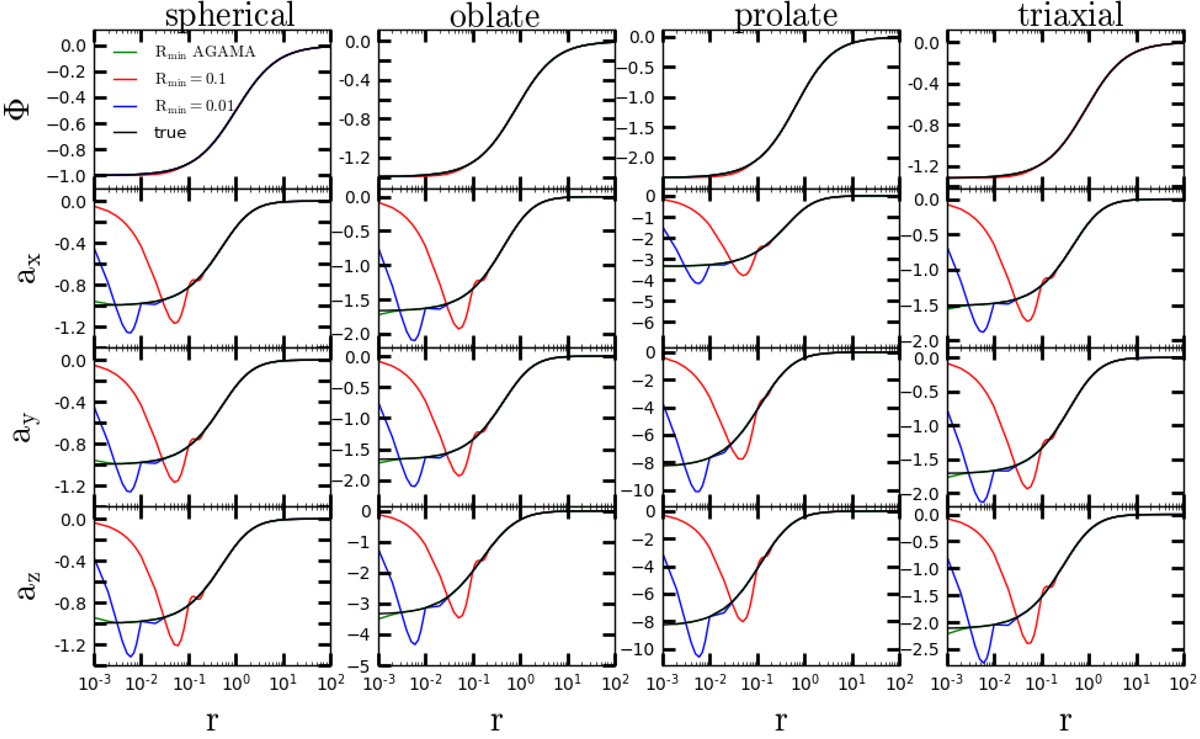
Same as in Fig. 1, but for the results of the CylSP method. In each panel, the red, and blue lines are the results of the CylSP method with Rmin = 0.1, and 0.01, respectively, while the green lines correspond to the value calculated by the AGAMA software (see Sect. 3.2). The black line is the analytical result given by Merritt & Fridman (1996). Here Nz = NR = 40, zmin = Rmin, and Rmax = zmax = 100, mmax = 12.
Current usage metrics show cumulative count of Article Views (full-text article views including HTML views, PDF and ePub downloads, according to the available data) and Abstracts Views on Vision4Press platform.
Data correspond to usage on the plateform after 2015. The current usage metrics is available 48-96 hours after online publication and is updated daily on week days.
Initial download of the metrics may take a while.