Fig. 17.
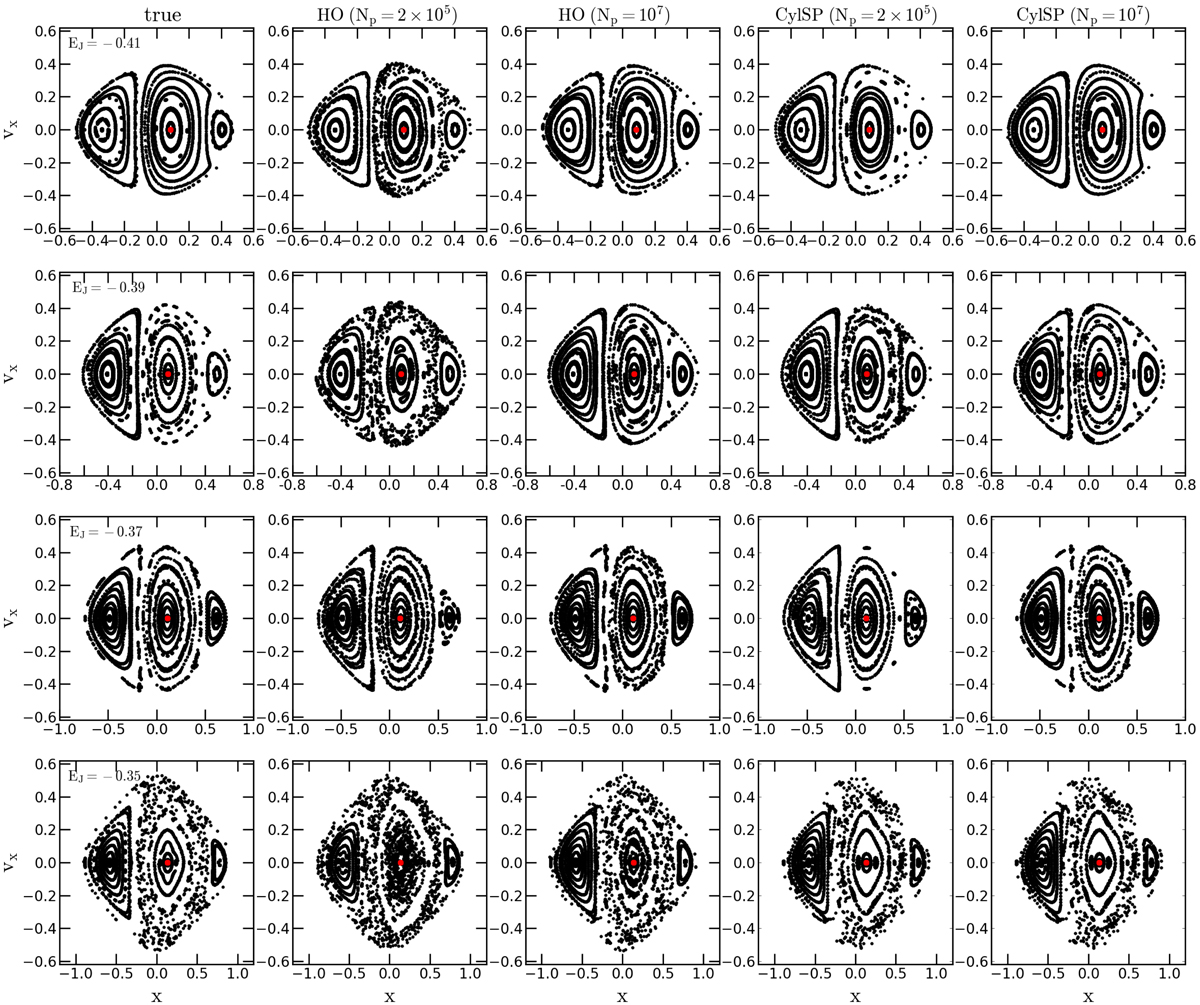
Surfaces of section (SOS) for the bar model. Left column: results for the analytic potential. Second and third columns: results for the HO method with Np = 2 × 10⁵ and Np = 107, respectively. Fourth and fifth columns: results for the CylSP method with Np = 2 × 10⁵ and Np = 107, respectively. From top to bottom: the rows correspond to EJ = −0.41, −0.39, −0.37, and −0.35, respectively. The red filled circle in each panel is the position of the x1 orbit.
Current usage metrics show cumulative count of Article Views (full-text article views including HTML views, PDF and ePub downloads, according to the available data) and Abstracts Views on Vision4Press platform.
Data correspond to usage on the plateform after 2015. The current usage metrics is available 48-96 hours after online publication and is updated daily on week days.
Initial download of the metrics may take a while.