Fig. 15.
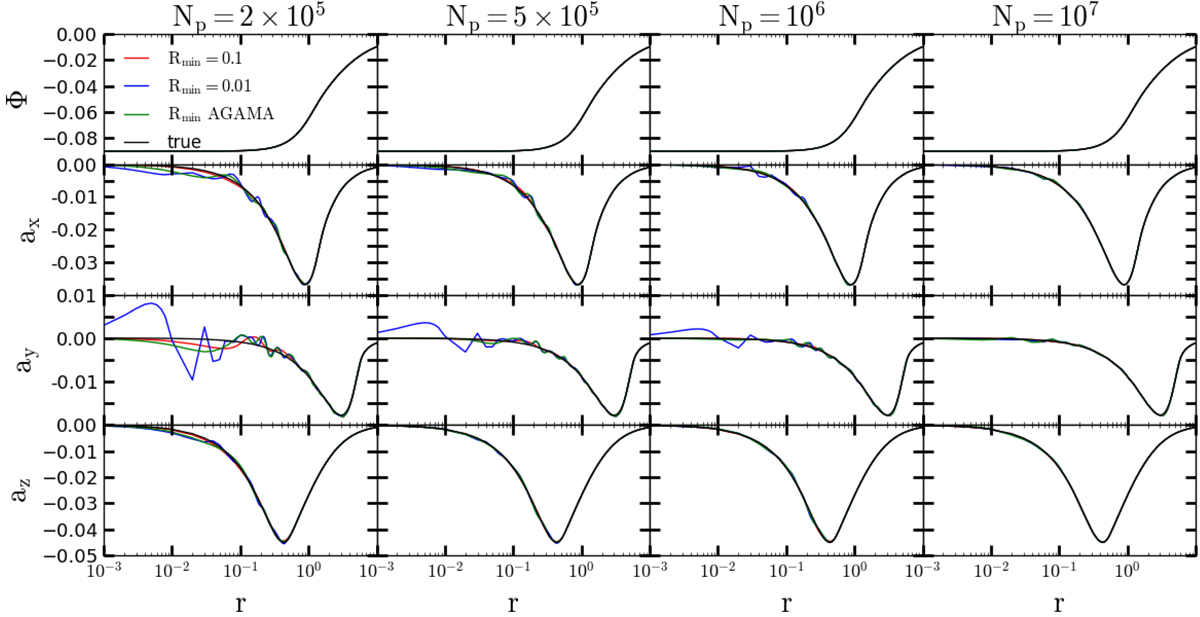
Potential and forces for the Ferrers bar with different redistribution numbers of particles. In each panel, the black line is the results for the model given by the analytical method. The red, blue and green lines represent the result in the CylSP method with Rmin = 0.1, Rmin = 0.01 and the value provided by AGAMA, respectively. From left to right: the results for N-body realizations with particle number 2 × 10⁵, 5 × 10⁵, 106, and 107, respectively.
Current usage metrics show cumulative count of Article Views (full-text article views including HTML views, PDF and ePub downloads, according to the available data) and Abstracts Views on Vision4Press platform.
Data correspond to usage on the plateform after 2015. The current usage metrics is available 48-96 hours after online publication and is updated daily on week days.
Initial download of the metrics may take a while.