Fig. 11.
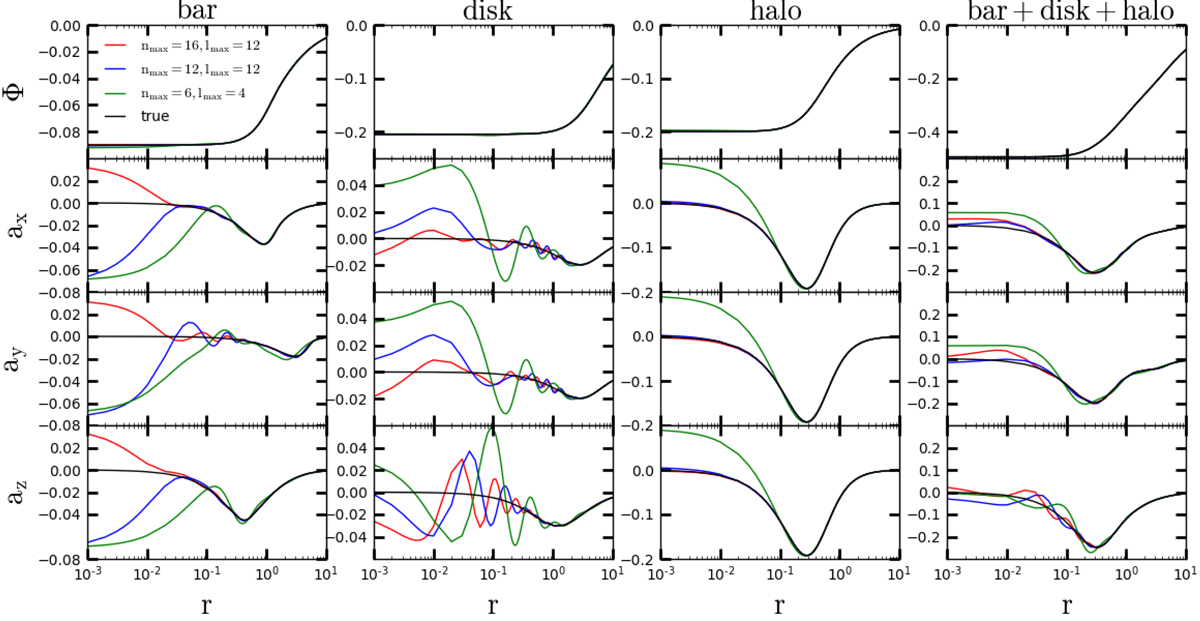
Potential and forces for the barred galaxy models and their individual components. From left to right: the input density model is the Ferrers bar, the MN disk, the Plummer halo, and the total, i.e., bar + disk + halo, respectively. In each panel, the black line corresponds to the results for the model given by the analytical method directly. The red, blue, and green lines are the results for the HO method with (nmax, lmax) = (16,12), (12,12), and (6,4), respectively.
Current usage metrics show cumulative count of Article Views (full-text article views including HTML views, PDF and ePub downloads, according to the available data) and Abstracts Views on Vision4Press platform.
Data correspond to usage on the plateform after 2015. The current usage metrics is available 48-96 hours after online publication and is updated daily on week days.
Initial download of the metrics may take a while.