Fig. 10.
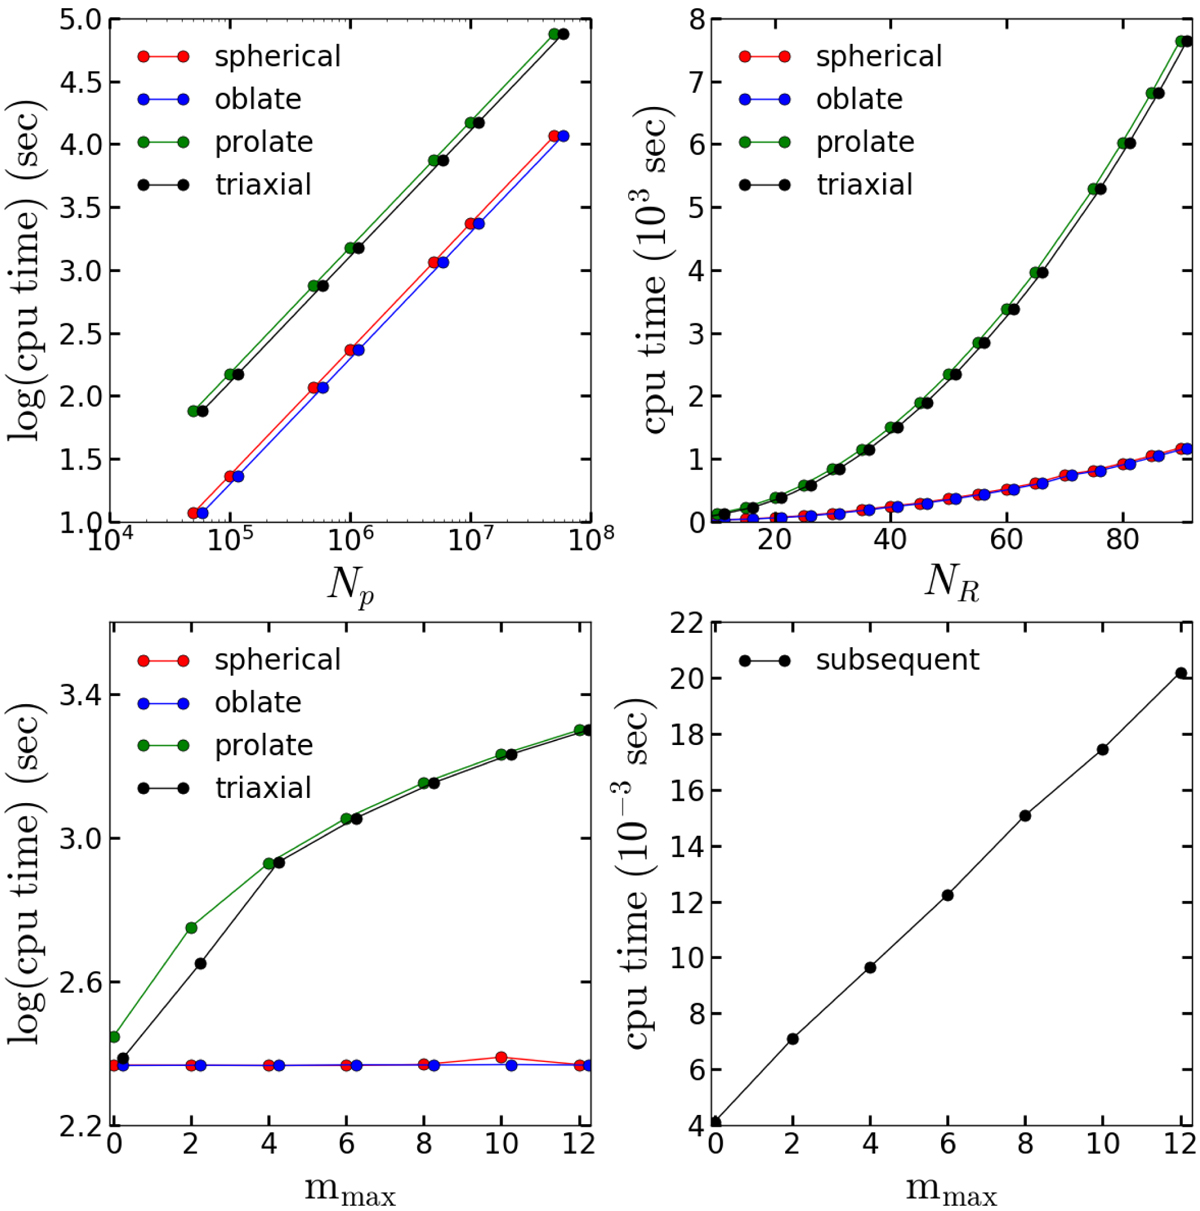
CPU time for the CylSP method. Top left: dependence of the initialization CPU time on the particle number of the Hernquist model realization. Top right: dependence of the initialization CPU time on the parameter NR for an N-body realization of the Hernquist model with Np = 106. Bottom left: dependence of the initialization CPU time on the parameter mmax for a snapshot of an N-body realization of the Hernquist model with Np = 106. Bottom right: dependence of the subsequent CPU time on the parameter mmax. The subsequent CPU time is estimated by the forces at 10 000 positions. Excluding the bottom right panel, the blue and black lines are slightly shifted to the right along the x-axis and the red, blue, green, and black lines are the results of the spherical, oblate, prolate, and triaxial models, respectively.
Current usage metrics show cumulative count of Article Views (full-text article views including HTML views, PDF and ePub downloads, according to the available data) and Abstracts Views on Vision4Press platform.
Data correspond to usage on the plateform after 2015. The current usage metrics is available 48-96 hours after online publication and is updated daily on week days.
Initial download of the metrics may take a while.