Fig. 1.
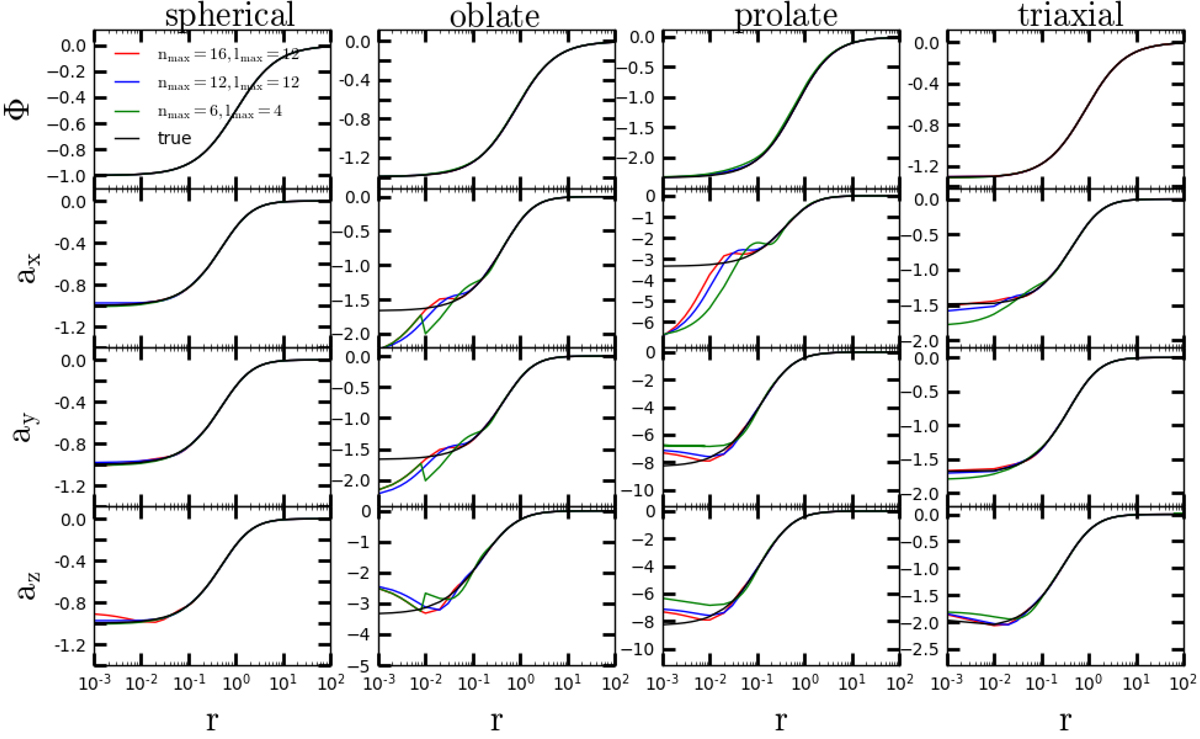
Potential and forces for the Hernquist models. From left to right: the input density model is spherical, oblate, prolate, and triaxial, respectively. In each panel, the black line is the result for the model given by Merritt & Fridman (1996). The red, blue, and green lines are the results for the HO method with (nmax, lmax) = (16,12), (12,12), and (6,4), respectively. From top to bottom: the radius r was measured along the x-, x-, y-, and z-axes, respectively. The x-axis is the major axis and the z-axis is the minor axis of the density distribution.
Current usage metrics show cumulative count of Article Views (full-text article views including HTML views, PDF and ePub downloads, according to the available data) and Abstracts Views on Vision4Press platform.
Data correspond to usage on the plateform after 2015. The current usage metrics is available 48-96 hours after online publication and is updated daily on week days.
Initial download of the metrics may take a while.