Free Access
Fig. 6
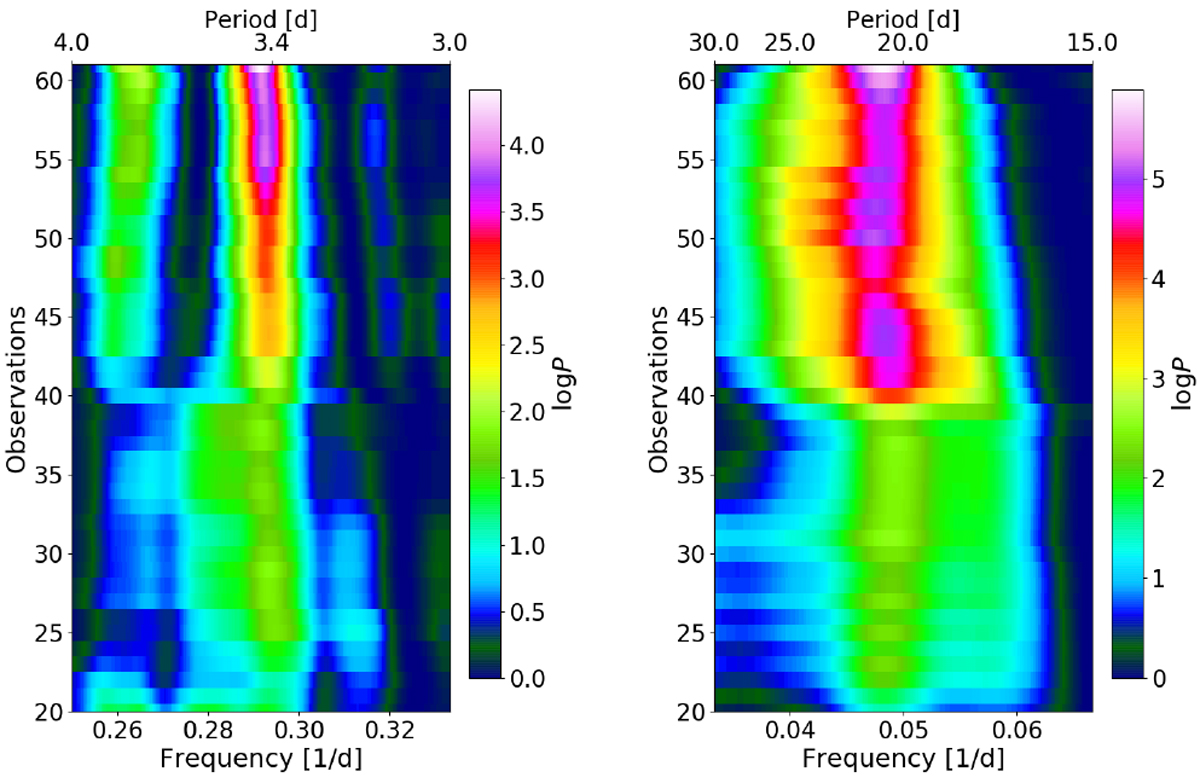
Evolution of the s-BGLS periodogram of the CARMENES and HARPS-N RV data of TOI-1235 around the 3.44 d signal of thetransiting planet (left) and around the 20.6 d activity signal after subtracting the planet signal (right). The number of data points included in the computation of the periodogram increases from bottom to top.
Current usage metrics show cumulative count of Article Views (full-text article views including HTML views, PDF and ePub downloads, according to the available data) and Abstracts Views on Vision4Press platform.
Data correspond to usage on the plateform after 2015. The current usage metrics is available 48-96 hours after online publication and is updated daily on week days.
Initial download of the metrics may take a while.