Fig. 1
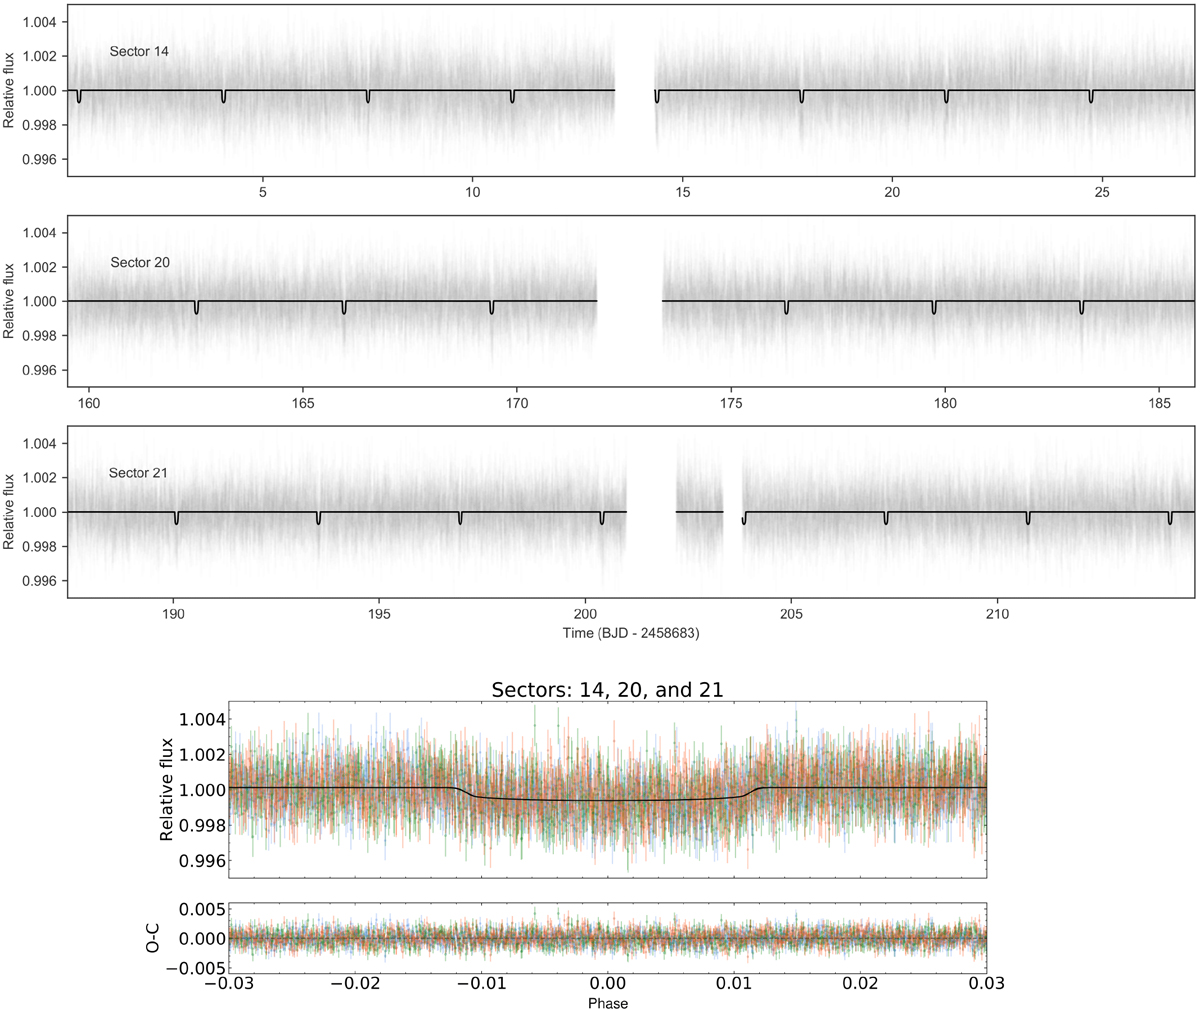
Top panel: TESS transit photometry for the three sectors (gray points) with the best-fit juliet model (black line; see Sect. 4.4 for details on the modeling). Bottom panel: phase-folded transit light curve of TOI-1235 b. The three sectors (14, 20, and 21) are color-coded in red, green, and blue, respectively. The best-fit model is depicted by the black curve.
Current usage metrics show cumulative count of Article Views (full-text article views including HTML views, PDF and ePub downloads, according to the available data) and Abstracts Views on Vision4Press platform.
Data correspond to usage on the plateform after 2015. The current usage metrics is available 48-96 hours after online publication and is updated daily on week days.
Initial download of the metrics may take a while.