Fig. 6.
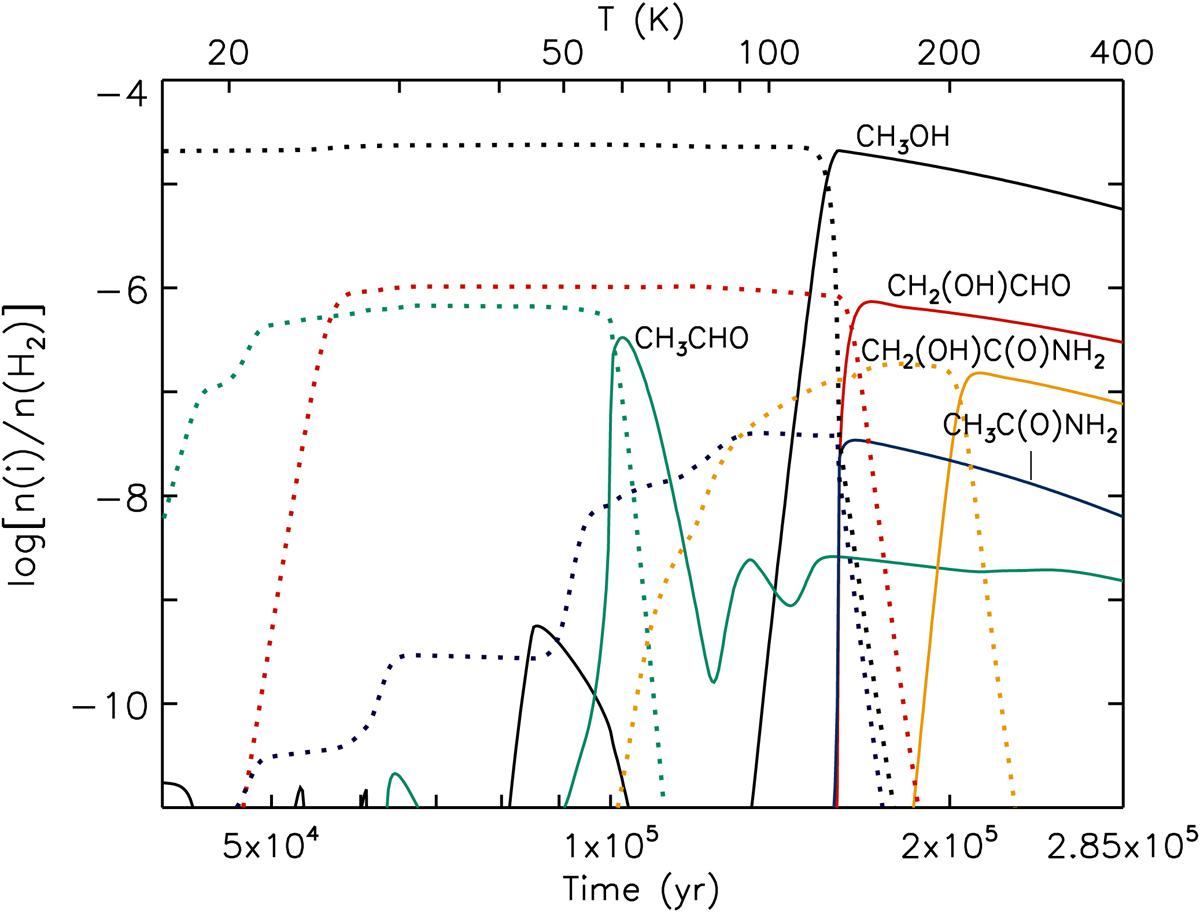
Chemical model results for the molecules whose observational data are shown in Table 5; methanol is included for reference. Solid lines indicate gas-phase abundances with respect to H2. Dashed lines of the same color indicate the solid-phase abundance of the same species, also with respect to gas-phase H2. Data shown correspond to the warm-up period following free-fall collapse.
Current usage metrics show cumulative count of Article Views (full-text article views including HTML views, PDF and ePub downloads, according to the available data) and Abstracts Views on Vision4Press platform.
Data correspond to usage on the plateform after 2015. The current usage metrics is available 48-96 hours after online publication and is updated daily on week days.
Initial download of the metrics may take a while.