Fig. 4.
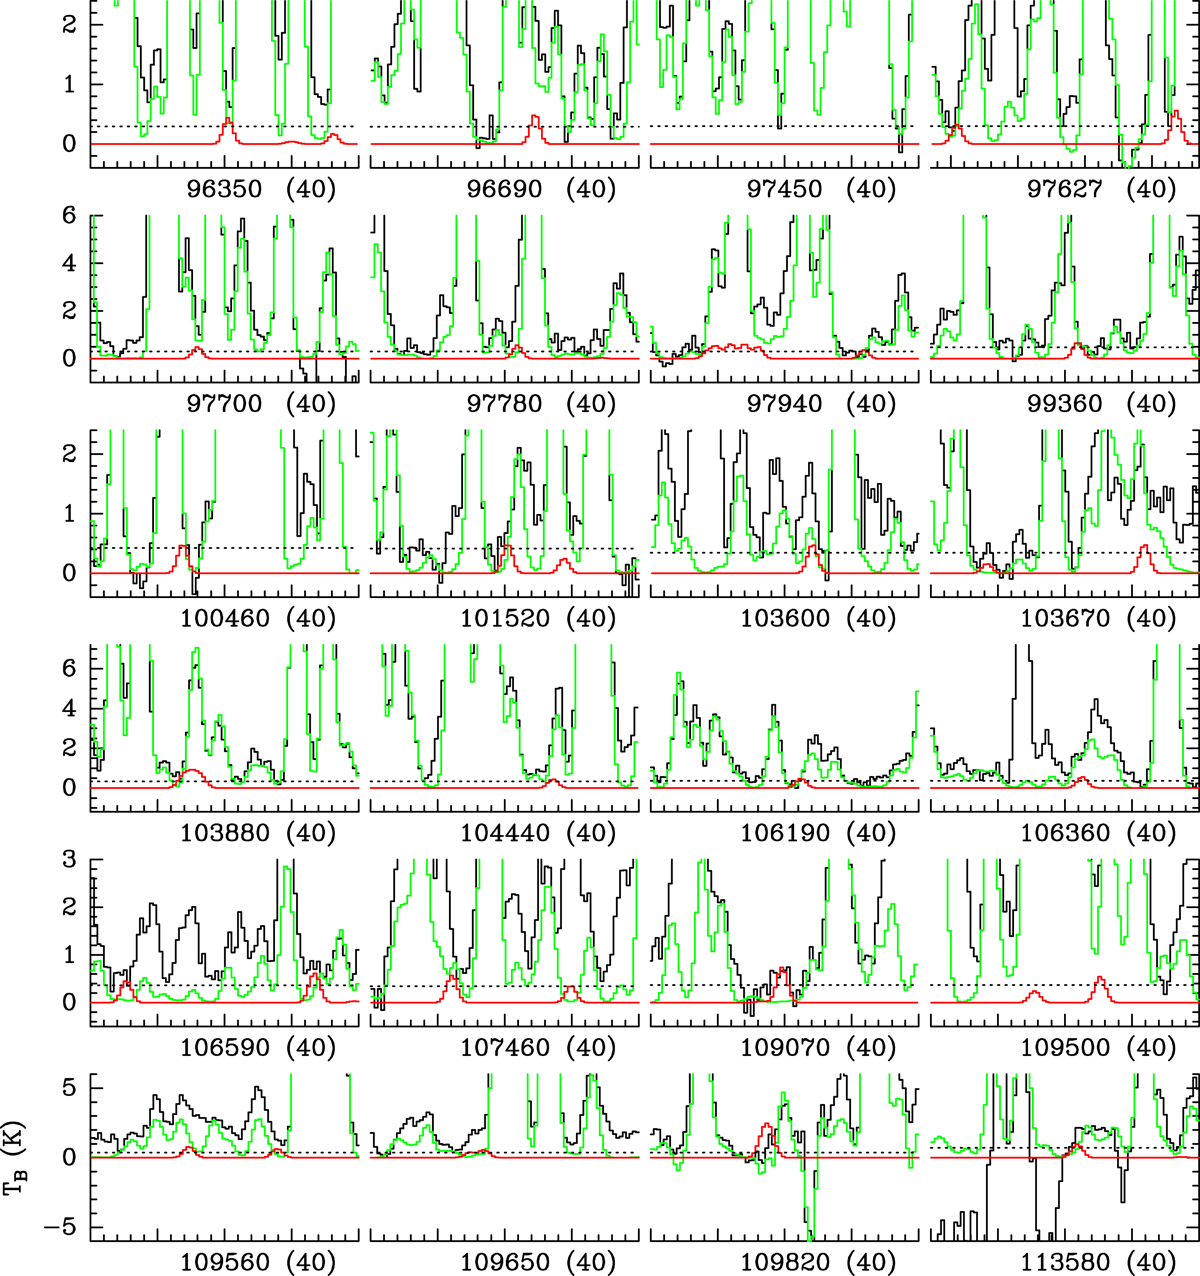
Synthetic LTE spectrum of glycolamide (in red) used to derive the upper limit to its column density, overlaid on the ALMA spectrum of Sgr B2(N2) (in black) and the synthetic spectrum that contains the contributions from all the species (but not from glycolamide) that we have identified so far in this source (in green). The dotted line in each panel indicates the 3σ noise level. For clarity purposes, the x-axis of each panel is only labeled with its central frequency followed by the value of the displayed frequency range in parentheses, both in MHz. The transitions of glycolamide that are weaker than 3σ and the ones which are heavily contaminated by other species are not shown.
Current usage metrics show cumulative count of Article Views (full-text article views including HTML views, PDF and ePub downloads, according to the available data) and Abstracts Views on Vision4Press platform.
Data correspond to usage on the plateform after 2015. The current usage metrics is available 48-96 hours after online publication and is updated daily on week days.
Initial download of the metrics may take a while.