Fig. 2.
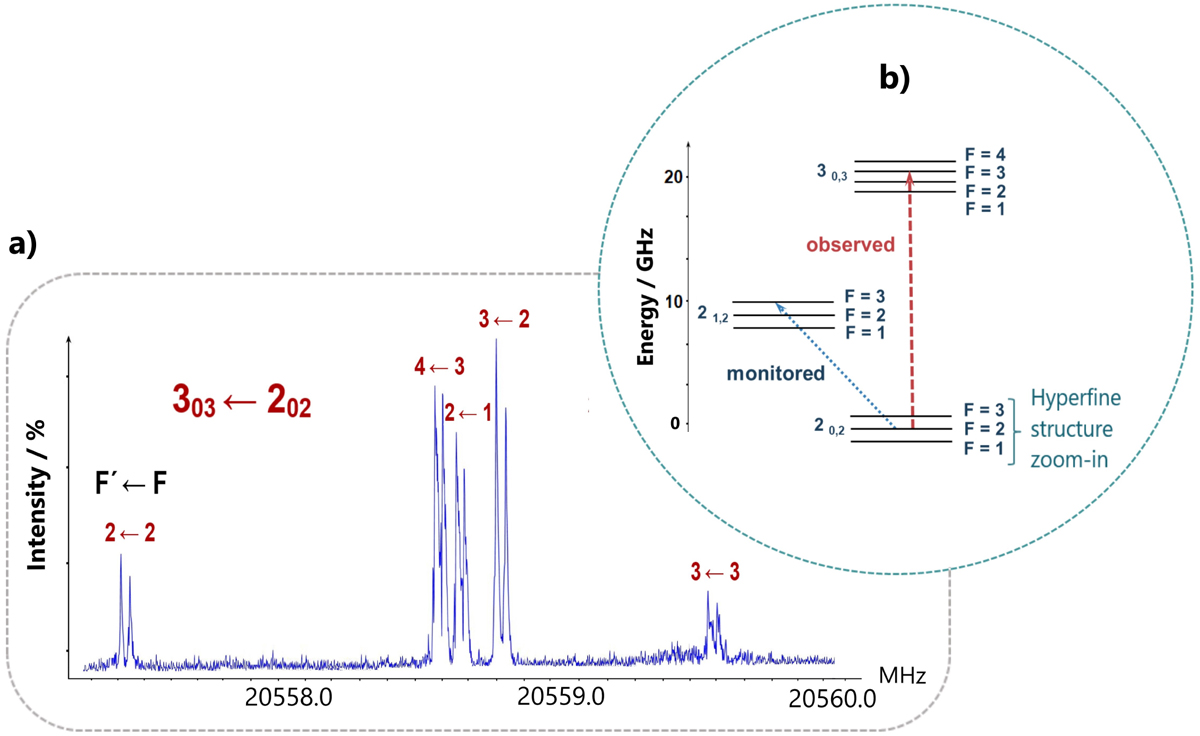
(a) Double-resonance spectrum of the 303 ← 202 rotational transition of syn-glycolamide showing five different hyperfine components. The 2 ← 2 and 3 ← 2 lines were observed monitoring the hyperfine component F = 2 of the rotational transition 212 ← 202, while the 2 ← 1 was observed monitoring the hyperfine component F = 1. And also arrows, and both 4 ← 3 and 3 ← 3 were observed monitoring the F = 3 component of the same rotational transition; (b) schematic energy level diagram (in GHz) relative to the 202 energy level of syn-glycolamide from the determined molecular constants. The hyperfine splittings are shown. Arrows indicate an example of the observed (dashed arrows in garnet) and monitored (dotted arrows in blue) transitions.
Current usage metrics show cumulative count of Article Views (full-text article views including HTML views, PDF and ePub downloads, according to the available data) and Abstracts Views on Vision4Press platform.
Data correspond to usage on the plateform after 2015. The current usage metrics is available 48-96 hours after online publication and is updated daily on week days.
Initial download of the metrics may take a while.