Fig. 1.
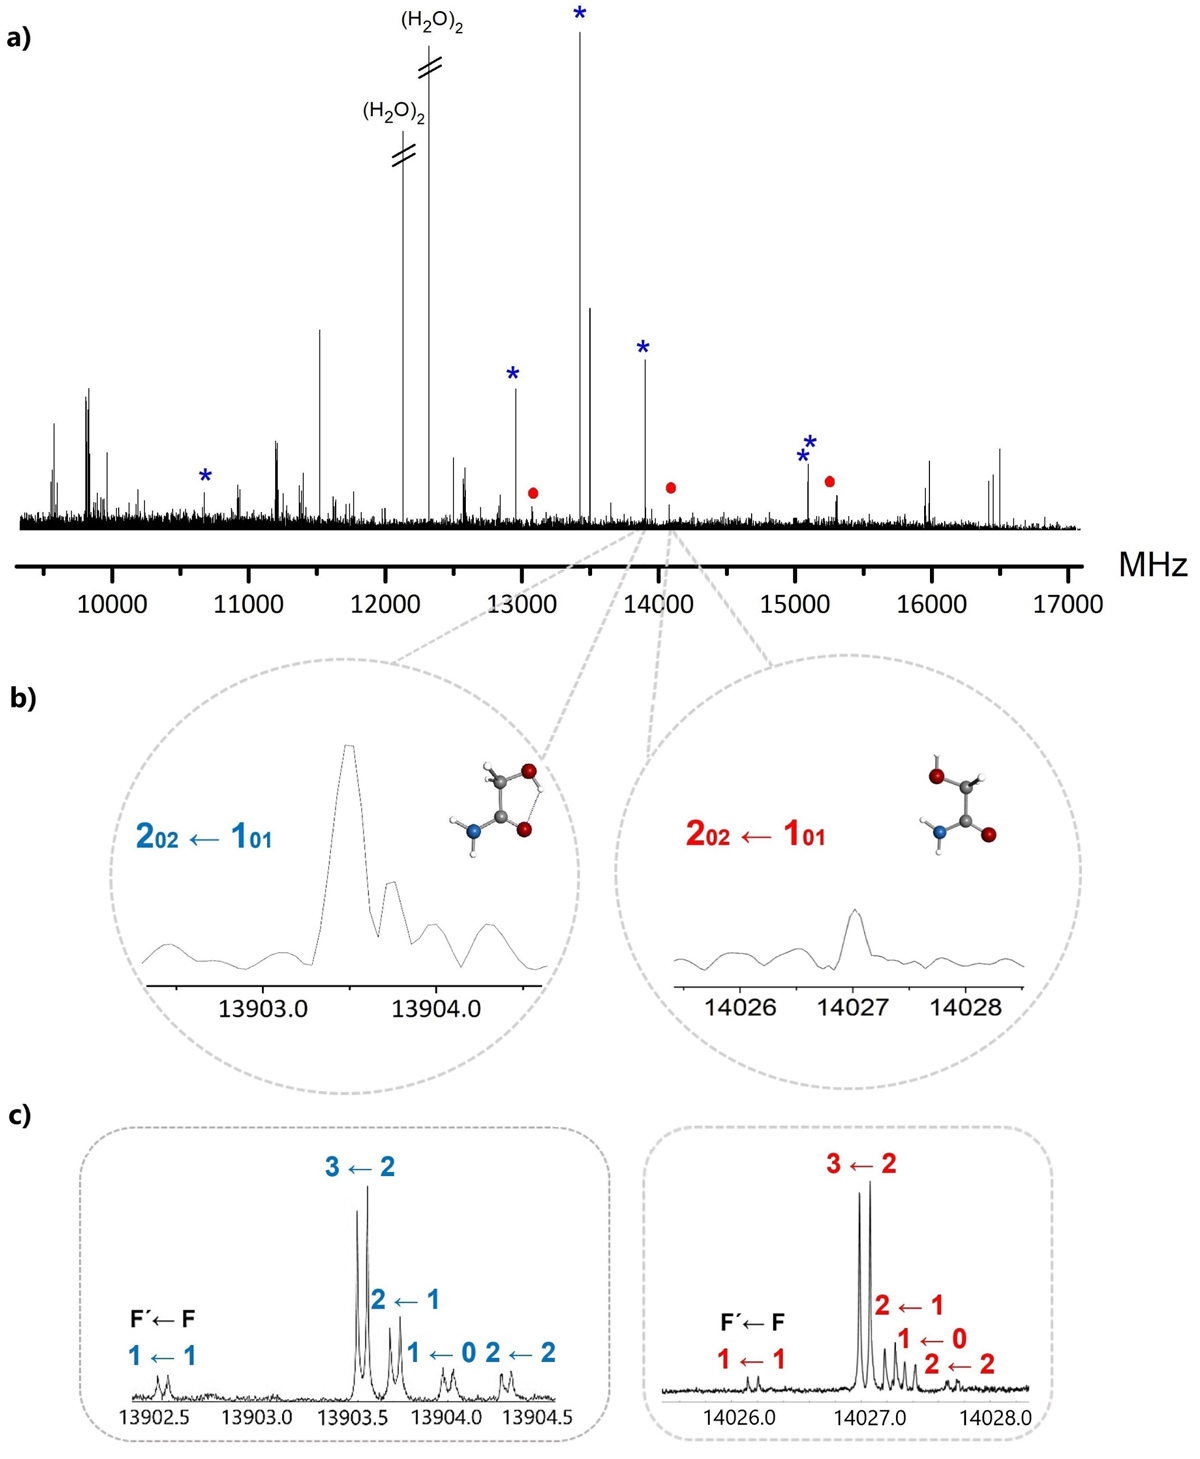
(a) Broadband CP-FTMW spectrum of glycolamide from 9.2 to 17.1 GHz. We depict strong a- and b-type R-branch transitions of syn-glycolamide (in blue) as well as some transitions of anti-glycolamide (in red). (b) Zoom-in section of the broadband spectrum showing the rotational transition 202 ← 101 of both syn-glycolamide and anti-glycolamide. (c) Same rotational transition measured in the MB-FTMW experiment, displaying the high resolution of our spectrometer. The resonance frequency is determined by the arithmetic mean of two Doppler components. The MB-FTMW spectrum was obtained by averaging 200experimental cycles (four free induction decay signals per cycle).
Current usage metrics show cumulative count of Article Views (full-text article views including HTML views, PDF and ePub downloads, according to the available data) and Abstracts Views on Vision4Press platform.
Data correspond to usage on the plateform after 2015. The current usage metrics is available 48-96 hours after online publication and is updated daily on week days.
Initial download of the metrics may take a while.