Fig. 9
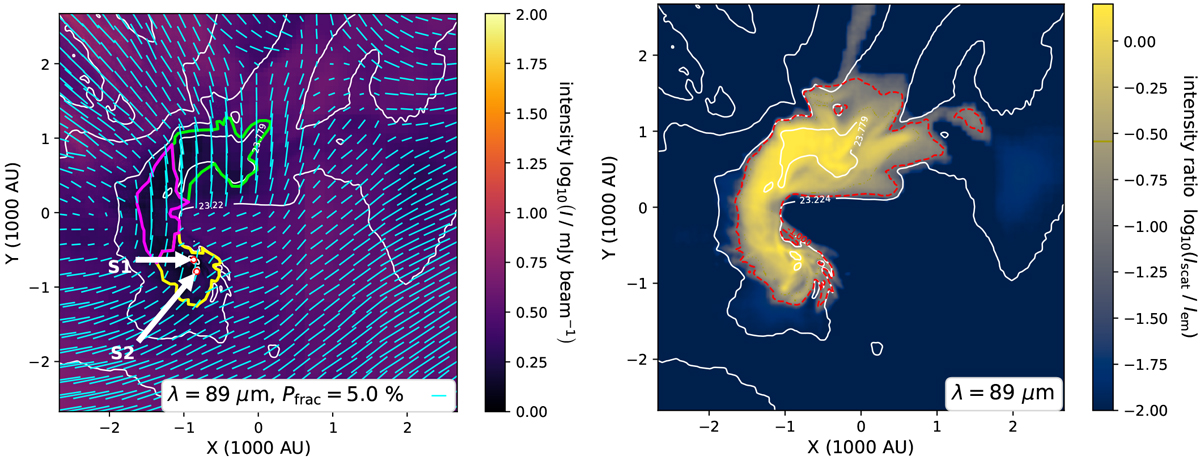
Left: same as the dust emission map in Fig. 6 considering only RAT alignment, but for a wavelength of 89 μm. Right: corresponding ratio of scattered Iscat to emitted radiation Iem. Red contours indicate the ratio Iscat∕Iem = 0.1. The polarization vectors are rotated by a considerable amount in D1, D2, and the bridge compared to the 1.3 mm observationsin Fig. 6.
Current usage metrics show cumulative count of Article Views (full-text article views including HTML views, PDF and ePub downloads, according to the available data) and Abstracts Views on Vision4Press platform.
Data correspond to usage on the plateform after 2015. The current usage metrics is available 48-96 hours after online publication and is updated daily on week days.
Initial download of the metrics may take a while.