Fig. 6
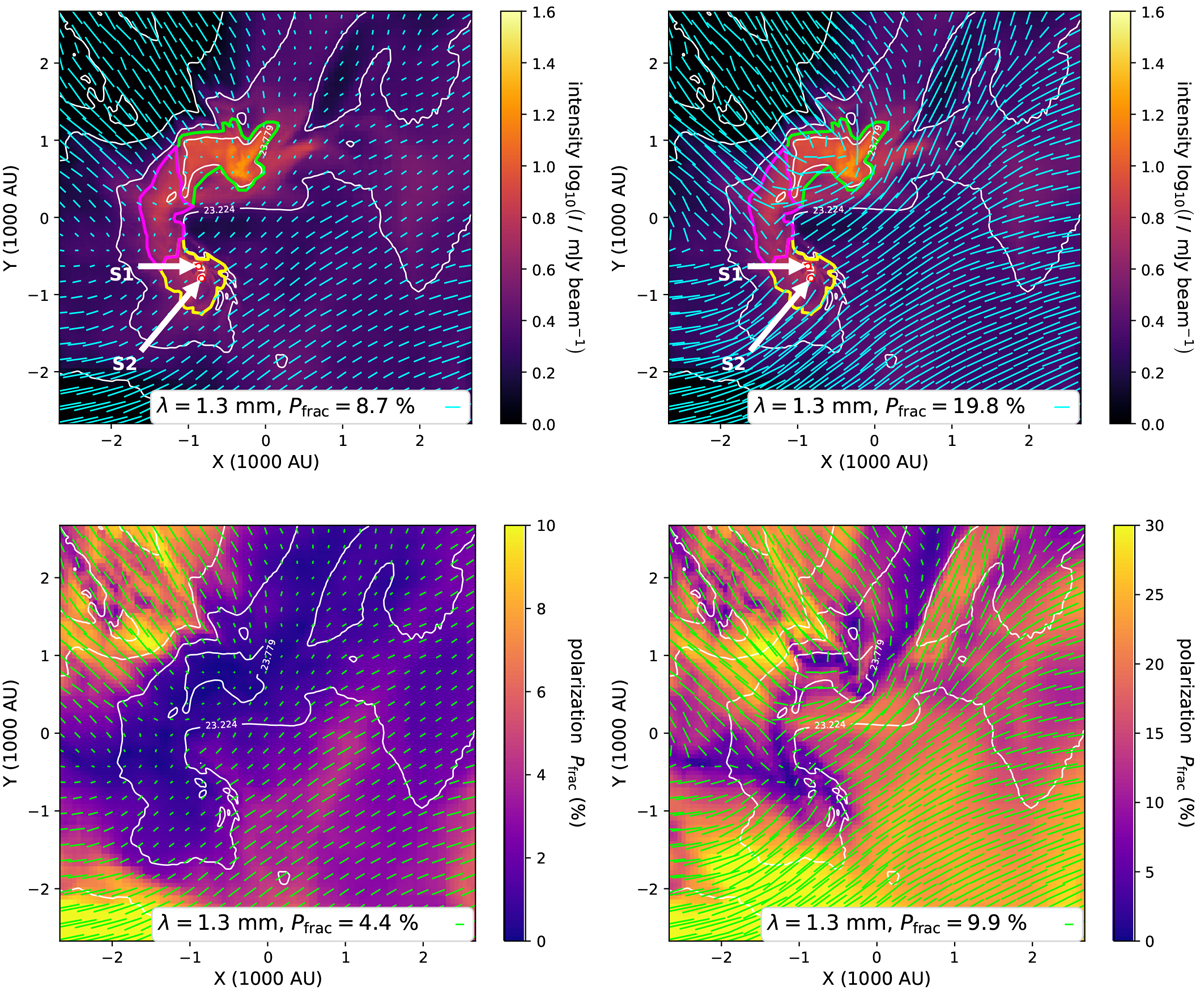
Top row: Stokes I component of the 1.3 mm dust emission considering RAT grain alignment (left) in comparison with perfect alignment (right). White contours show the logarithmic column density, while the length and orientation of the pseudovectors represent the degree and angle of the linear dust polarization. The polarization vectors are rotated by 90° to match the actual magnetic field direction. The area of the bridge structure is enclosed by purple lines, while the natal structures that harbor the primary and secondary (D1) are shown in yellow and the natal structure of the tertiary (D2) is plotted in green. The borders follow the contour line of I = 4.24 mJy beam−1. Bottom row: same as the top row, but the color-scale now shows the polarized fraction, Pfrac.
Current usage metrics show cumulative count of Article Views (full-text article views including HTML views, PDF and ePub downloads, according to the available data) and Abstracts Views on Vision4Press platform.
Data correspond to usage on the plateform after 2015. The current usage metrics is available 48-96 hours after online publication and is updated daily on week days.
Initial download of the metrics may take a while.