Fig. 10
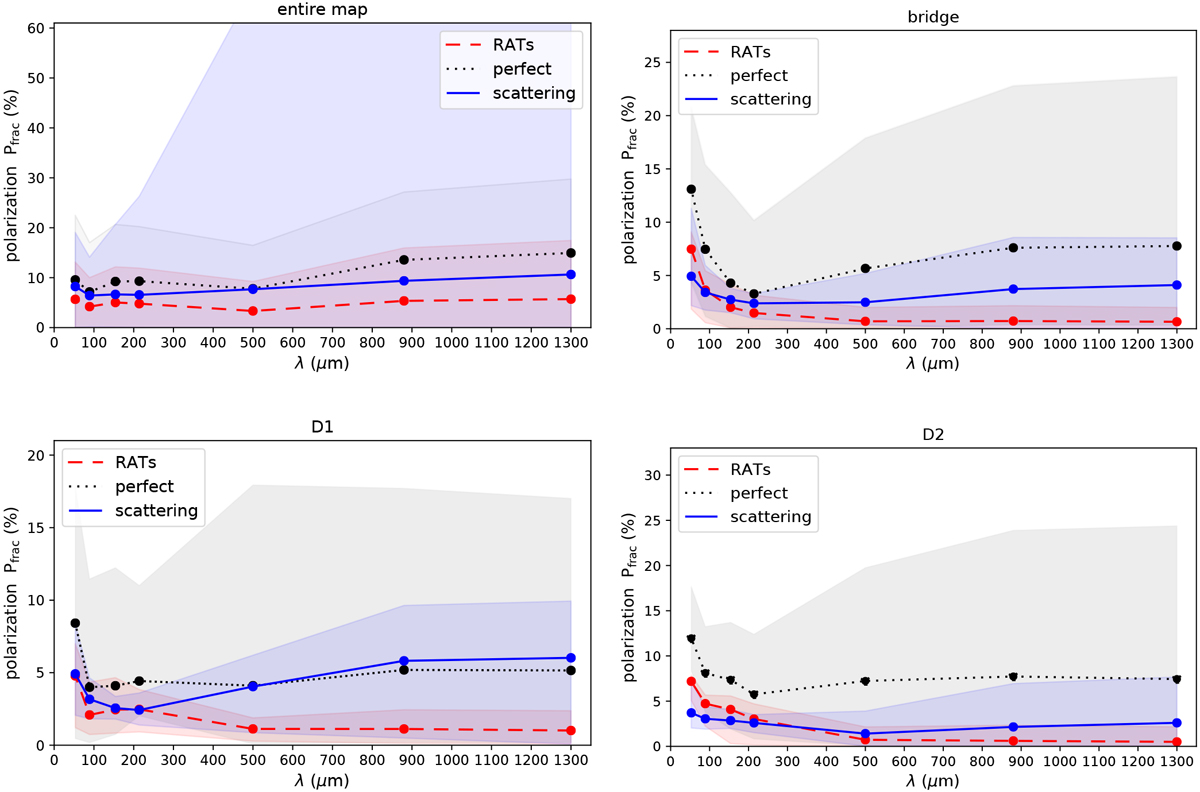
Degree of linear polarization Pfrac dependent on wavelength assuming RAT-aligned grains (long-dashed red), perfect alignment (short-dashed black), and scattering (solid blue) for the entire maps of intensity I (top left) shown in Figs. 6 and 7, together with the bridge (top right) and the regions D1 (bottom left) and D2 (bottom right). The lines represent the average values of the entire region, while the corresponding shaded areas indicate the range between maximum and minimum values.
Current usage metrics show cumulative count of Article Views (full-text article views including HTML views, PDF and ePub downloads, according to the available data) and Abstracts Views on Vision4Press platform.
Data correspond to usage on the plateform after 2015. The current usage metrics is available 48-96 hours after online publication and is updated daily on week days.
Initial download of the metrics may take a while.