| Issue |
A&A
Volume 639, July 2020
|
|
|---|---|---|
| Article Number | L9 | |
| Number of page(s) | 11 | |
| Section | Letters to the Editor | |
| DOI | https://doi.org/10.1051/0004-6361/202038091 | |
| Published online | 14 July 2020 | |
Letter to the Editor
Larger λR in the disc of isolated active spiral galaxies than in their non-active twins
1
Instituto de Astrofísica de Canarias, C/ Vía Láctea, s/n, 38205 La Laguna, Tenerife, Spain
e-mail: This email address is being protected from spambots. You need JavaScript enabled to view it.
2
Departamento de Astrofísica, Universidad de La Laguna, 38206 La Laguna, Tenerife, Spain
3
Instituto de Astronomía, Universidad Nacional Autónoma de México, A. P. 70-264, 04510 CDMX, Mexico
4
Departamento de Física de la Tierra y Astrofísica, Universidad Complutense de Madrid, 28040 Madrid, Spain
5
IPARCOS, Facultad de CC Físicas, Universidad Complutense de Madrid, 28040 Madrid, Spain
6
Instituto de Astrofísica de Andalucía (CSIC), Glorieta de la Astronomía s/n, 18008 Granada, Spain
Received:
3
April
2020
Accepted:
20
June
2020
Abstract
We present a comparison of the spin parameter λR, measured in a region dominated by the galaxy disc, between 20 pairs of nearby (0.005 < z < 0.03) seemingly isolated twin galaxies differing in nuclear activity. We find that 80−82% of the active galaxies show higher values of λR than their corresponding non-active twin(s), indicating larger rotational support in the active galactic nuclei (AGN) discs. This result is driven by the 11 pairs of unbarred galaxies, for which 100% of the AGN show larger λR than their twins. These results can be explained by a more efficient angular momentum transfer from the inflowing gas to the disc baryonic matter in the case of the active galaxies. This gas inflow could have been induced by disc or bar instabilities, although we cannot rule out minor mergers if these are prevalent in our active galaxies. This result represents the first evidence of galaxy-scale differences between the dynamics of active and non-active isolated spiral galaxies of intermediate stellar masses (1010 < M* < 1011 M⊙) in the Universe.
Key words: galaxies: active / galaxies: nuclei / galaxies: kinematics and dynamics
© ESO 2020
1. Introduction
Observational evidence suggests a co-evolution of the central supermassive black holes (SMBHs; see Ho 2008 for a review) and their host galaxies (see e.g. Kormendy & Ho 2013). Unveiling the mechanism(s) controlling this co-evolution is crucial to improve our understanding of the formation and evolution of galaxies. Active galactic nuclei (AGN) feedback has been proposed as the main mechanism regulating SMBH and galaxy growth in massive galaxies, and it can act in different ways (e.g. Fabian 2012). Understanding how nuclear activity is triggered and whether all massive galaxies go through an active phase is then of great importance. Significant observational effort has been made to observe the closest environment of SMBHs in order to study AGN fuelling (e.g. García-Burillo et al. 2005; Ramos Almeida & Ricci 2017; Storchi-Bergmann & Schnorr-Müller 2019 and references therein). To induce inflows of gas towards the galactic centre, the gas in the host galaxy has to lose angular momentum, but the dominant mechanism(s) that transport the gas from galaxy scales to the central parsecs in AGN are not clear yet (Alexander & Hickox 2012). In this respect, the definition of non-active samples is essential to search for properties that might be unique to AGN. Legacy integral field spectroscopy (IFS) surveys such as ATLAS3D (Cappellari et al. 2011), CALIFA (Sánchez et al. 2012), SAMI (Croom et al. 2012), MASSIVE (Ma et al. 2014), or MaNGA (Bundy et al. 2015) now provide the opportunity to select almost identical pairs of galaxies differing only in nuclear activity. By comparing the kinematic properties of these pairs it should be possible to spot differences connected to AGN triggering (del Moral-Castro et al. 2019, hereafter dMC19).
An effective way to quantify the global velocity structure of galaxies taking advantage of IFS is λR (Emsellem et al. 2007). This dimensionless spin parameter permits us to assess the rotational support of a galaxy, similarly to V/σ, and it goes to unity when rotation dominates. Thanks to the previously mentioned IFS surveys it has been possible to study λR for a large number of galaxies covering a wide range of morphological types and stellar masses (Cappellari 2016; Colless 2018). These data have been used to look for dependences with different global galaxy properties. For example, Krajnović et al. (2013) studied a sample of early-type galaxies from ATLAS3D and found that λR decreases with increasing bulge fraction. This dependence was confirmed for a wider range of galaxy morphologies by Falcón-Barroso et al. (2019) using data from CALIFA. An anti-correlation between λR (or V/σ) and stellar mass (M*) has also been reported using data from MASSIVE and ATLAS3D (Veale et al. 2017) along with MaNGA (Graham et al. 2018) and SAMI (van de Sande et al. 2018). It is noteworthy that none of the latter works studied possible differences in λR between active and non-active galaxies. A few works based on large IFS surveys comparing different properties of active and non-active galaxies have been published (e.g. Rembold et al. 2017; Sánchez et al. 2018; Lacerda et al. 2020). In Sánchez et al. (2018), based on MaNGA data and including 98 AGN, the authors report that on average these AGN have lower rotational support (∼65%) than the non-active galaxies within 1 Re (i.e. bulge-dominated). This trend is mainly driven by late-type galaxies, which dominate their AGN sample (see Fig. 2 in Sánchez et al. 2018). Ilha et al. (2019) performed a kinematic analysis of 62 AGN from MaNGA and report larger differences between σgas and σstars in the central kiloparsec of the active galaxies than in the corresponding control sample.
In dMC19 we performed a pilot study based on two low-luminosity isolated active galaxies (barred and unbarred) and their two non-active twins matched in galaxy properties using data from the CALIFA survey. Our goal was to identify large-scale differences between the twins that could be related to AGN triggering. From the analysis of this pilot sample we found that each active galaxy had larger λR within 1 Re and globally, internal twists in their gas discs, dynamical lopsidedness, and older stellar populations in the central kiloparsec of the galaxy than its corresponding non-active twin. In view of these results, we decided to extend this study to a larger sample of twin galaxies differing in nuclear activity selected from CALIFA. This is the first work focussed on studying the differences in stellar λR between active and non-active galaxies matched in galaxy properties and based on one-to-one comparisons. In the following we assume a standard ΛCDM model with H0 = 71 km s−1 Mpc−1, Ωm = 0.27 and ΩΩ = 0.73.
2. Observations and sample selection
We used data from the third data release (Sánchez et al. 2016) of the CALIFA survey (Sánchez et al. 2012), which corresponds to 667 galaxies in the Local Universe (0.005 < z < 0.03). Méndez-Abreu et al. (2017) selected 404 of these galaxies to characterise their 2D morphology, discarding interacting systems, mergers, and highly inclined galaxies (i > 70°). This is the parent sample of this work. We used the fully reduced COMBO data cubes, which are a combination of those obtained with the V500 (wavelength range 3745−7500 Å, R ∼ 850) and V1200 (3700−4840 Å, R ∼ 1650) gratings. We do not have COMBO data cubes for two of the galaxies and we used the V500 instead. Details on the observational strategy, data quality, data reduction, and statistical properties of the CALIFA survey can be found in Sánchez et al. (2012, 2016), Walcher et al. (2014) and García-Benito et al. (2015).
In order to identify isolated galaxies in CALIFA we followed the criteria of Barrera-Ballesteros et al. (2014). We discarded galaxies having companions with similar systemic velocity (absolute difference smaller than 1000 km s−1) and SDSS r-band magnitudes (within 2 mag) within a physical radius of 250 kpc. By doing this we discard major mergers and interactions, but we cannot rule out the presence of minor mergers.
To select our AGN sample we first used the codes PPXF (Cappellari & Emsellem 2004; Cappellari 2017) and GANDALF (Sarzi et al. 2006; Falcón-Barroso et al. 2006) to characterise the emission line profiles of the central spaxel of each galaxy. We consider as AGN candidates all the objects above the Kewley et al. (2001) demarcation curve in the three classical BPT diagrams (Baldwin et al. 1981) that lie in the Seyfert region of the [OIII]/[OII] versus [NII]/Hα diagram (Cid Fernandes et al. 2010). Using these criteria we identified 19 isolated active galaxies with Hubble types from Sa/SBa to Sbc/SBbc. In this work, we focus on spiral galaxies because we are interested in the study of λR of the stars in the disc component (see Sect. 3 for further details). These galaxies are low-luminosity AGN, making them ideal candidates to look for triggering imprints and characterise the stellar populations of their host galaxies.
For each AGN we then selected a control sample of non-active galaxies with similar galaxy properties (twin galaxies). By doing this any possible difference between the twins should be associated with nuclear activity. We matched the twins in Hubble type, stellar mass (M*), absolute magnitude in the r band (MR), and disc ellipticity in the r band (ϵ). Absolute differences are smaller than 0.25 log(M*/M⊙), 0.70 mag, and 0.20, respectively (see Table 1). Applying these criteria we did not find a twin for 5 of the 19 active galaxies. In the case of the barred active galaxies we selected twins with bar radius differences below 3 kpc. With this restriction we have another 3 AGN lacking of twins. This leaves us with a final sample of 11 active spiral galaxies (10 type 2 and 1 type 1 AGN), of which 5 are barred and 6 unbarred.
Sample properties.
Finally, we visually inspected the SDSS images of each active galaxy and its corresponding twin candidates to select the most similar one (best twin hereafter; see Fig. 1 for an example) and discarded only those that clearly have different appearances. After doing this we end up with 5 AGN with 2 or more non-active twins. In these cases, we always identified the best twin but we did not discard the others. Furthermore, 5 non-active galaxies are selected as twins of 2 different AGN. In total we have 20 pairs of isolated twin galaxies differing in nuclear activity (see Table 1 and Appendix A).
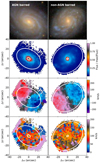 |
Fig. 1. Colour-composite SDSS images and CALIFA stellar flux, velocity, and velocity dispersion maps (from top to bottom) of one pair of twin galaxies: NGC 0214 (AGN; left column) and NGC 2253 (non-AGN; right column). The white ellipses indicate the boundaries of disc region defined in Sect. 3 (2 |
3. Methodology
The stellar kinematics were calculated following the same methodology as in dMC19. We removed all the spaxels with S/N < 3 and spatially binned the spaxels using the Voronoi 2D binning method (Cappellari & Copin 2003) to achieve S/N of ∼30. We used pPXF to fit the 3800−7000 Å spectral range. Finally, λR was measured as in Emsellem et al. (2007) as follows:
 (1)
(1)
where Ri, Fi, Vi, and σi are the distance to the centre, flux, stellar velocity, and velocity dispersion per spatial bin i.
λR is usually calculated within one effective radius or radially (see e.g. Falcón-Barroso et al. 2019 and references therein). By comparing the stellar λR radial profiles of the two AGN and their non-active twins, in dMC19 we found the largest differences in the galaxy discs. Furthermore, the interpretation given in dMC19 to explain the differences in λR between twin galaxies differing in nuclear activity also suggested that we focus on the region dominated by the disc (see Sect. 4). To identify this region in each galaxy we used the 2D photometric decomposition from Méndez-Abreu et al. (2017). This way we can determine the radius at which the intersection between the bulge and disc profiles happens. We find that this radius is never larger than two times the bulge effective radius ( ). Therefore, we can select 2
  as the inner radius of the region where the disc component dominates over the bulge for all the galaxies in the sample. To determine the disc outer radius (Rout) we have to consider the extent of the galaxies in the CALIFA data. We define Rout as the radius of the outermost ellipse without empty spaxels/voxels (see Table 1 and Fig. 1). Thus, we used the annular region between 2
  and Rout to calculate λR in the disc1.
In order to calculate uncertainties we used Monte Carlo simulations, adding the corresponding errors of the CALIFA data cubes to the spectrum of each voxel following a Gaussian distribution. The procedure was repeated 100 times, resulting in 100 different λR values. The standard deviation of this distribution of values is our statistical error, which is always smaller than 0.01. In the following we consider 0.01 as the error of each λR.
4. Results and discussion
Figure 2 shows the differences in λR of the disc (ΔλR) between each AGN and its twin(s). Considering only the best twins (indicated with green circles in Fig. 2), we find 9/11 (82%) pairs in which the active galaxy has higher λR than its twin. If we consider the 20 pairs of galaxies the percentage is similar: 16/20 (80%) have ΔλR > 0.01 (i.e. larger than the corresponding error). The case of UGC 03973, the only type 1 AGN in our sample, is noteworthy because it has considerably lower λR than its two twins. This could be related to nuclear contamination of the central spaxels associated with the large point spread function (PSF) size of the CALIFA data. It is worth mentioning, however, that using a sample of 98 AGN from MaNGA, Sánchez et al. (2018) report a tendency of type 1 AGN to be hosted in more massive, centrally concentrated and pressure-supported galaxies (within 1 Re) than type 2 AGN. If these results are confirmed it would provide support to an evolutionary transition between types rather than mere orientation-based differences. A larger AGN sample is required to investigate whether type 1 AGN have different kinematics than type 2 AGN.
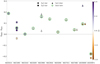 |
Fig. 2. Differences in stellar λR between the pairs of twin galaxies. The best twin of each AGN is indicated with a green circle. Each column corresponds to an active galaxy and each symbol to the difference in λR with each of its twins. The colour code indicates the difference in ellipticity (ϵAGN − ϵtwin, see Table 1). Error bars correspond to propagation of the individual uncertainties (see Sect. 3). |
As we mentioned in Sect. 2, we have 5 barred AGN and 6 without bars. If we only consider the unbarred galaxies in our sample, we find that 11/11 pairs (100%) show ΔλR > 0.01. In the case of the barred galaxies, we have 5/9 pairs (56%), 5/7 (71%) if we do not consider the type 1 AGN.
λR is derived from projected quantities and therefore it depends on the viewing angle (Emsellem et al. 2007). However, for our twins the effect of galaxy inclination on ΔλR should be small because we matched them in disc ellipticity (ϵ). In Fig. 2 we show with different colours the differences in ellipticity (Δϵ) between each AGN and its corresponding twin(s), which are always smaller than 0.2 (see Sect. 2). Seven active galaxies have higher ϵ than their twins (i.e. more inclined, seven have lower ϵ, and four are almost identical. Thus, the slightly different inclinations between twins would not be driving the difference in λR. To further confirm this, we deprojected the individual λR values as described in Appendix B. Considering these values and their corresponding errors (see Table 1), the percentage of AGN having larger λR than their best twins remains the same (82%) and this amount is 70% when we consider all the pairs (14/20). Thus we confirm that the effect of inclination on ΔλR for the galaxies in our sample is small. It is noteworthy that the six pairs in which the AGN have smaller or equal λR than its twin(s) are all barred. For the unbarred twins, we continue having positive ΔλR in 100% of the pairs after deprojecting.
The stellar ages of the discs could also have an influence on λR since there is a relation between age and V/σ (the older the stellar population the lower V/σ and viceversa; e.g. van de Sande et al. 2018). In order to explore this possibility we characterised the stellar populations of the galaxies in the same region as λR via the code STECKMAP (Ocvirk et al. 2006a,b). We used a similar methodology as in dMC19. In Appendix C we show an alternative version of Fig. 2 indicating the differences in light-weighted averaged stellar age in different colours. In general, the discs of AGN are older than those of their twins (13/20; red symbols in Fig. C1; see also Lacerda et al. 2020), whilst the other seven show equal or younger ages. The maximum differences are ±1.4 Gyr. This is the opposite of what we would expect if the differences in λR were driven by the differences in the stellar ages of their discs. We also note that for some AGN with more than one twin, the differences in stellar age are both positive and negative (e.g. NGC 1093, UGC 00005 and UGC 03973). This constitutes further indications that differences in stellar age are not driving our result. A detailed study of the stellar populations of these galaxies including the central regions will be the subject of a forthcoming work (del Moral-Castro, in prep.).
Another parameter that could have an influence on λR is the bulge fraction (Krajnović et al. 2013), with the larger the bulge-to-total flux ratios (B/T) the lower the λR. Although our twins are matched in Hubble type and M* and in this work we compare λR in the region dominated by the disc, we evaluate whether possible differences in the B/T fractions might have any influence on our result. In Appendix C we show another version of Fig. 2 with different colours indicating the differences in B/T measured from SDSS r-band photometry (Méndez-Abreu et al. 2017). Nine active galaxies have higher B/T than their corresponding twins and 10 have lower values2 (see Fig. C2). Comparing galaxies with relatively large differences in effective radius (Re) could also have an impact on ΔλR. There are 8 AGN with higher Re than their twins and 12 showing lower Re. Considering only the 13 pairs with smaller Re differences than 30% of the AGN Re, we have 9/13 pairs (69%) having ΔλR > 0.1 and 6/8 pairs (75%) if we only consider the best twins. Finally, galaxies with larger M* generally have lower λR values (e.g. Veale et al. 2017). In our case, 10 AGN have larger M* than their twins, and 10 have lower M* (see Table 1). Thus, the differences in stellar λR are not driven by smaller bulge fraction, Re, or M* of the AGN relative to their twins.
The results presented in this work provide statistical support to the preliminary interpretation of our pilot study (dMC19). We identify the higher λR measured in the discs of isolated AGN as the imprint of the angular momentum transfer from the inflowing gas to the baryonic matter in the disc (Kormendy 2013; Saha & Jog 2014). A large-scale disc or bar instability would have induced gas to move from the disc to the central region, triggering nuclear activity. For this inflow to happen, the gas had to efficiently transfer angular momentum to the baryonic matter remaining in the disc to conserve the total angular momentum of the isolated system. As a consequence of this internal angular momentum redistribution, the galactic disc got dynamically colder (i.e. higher λR). In the case of the barred galaxies, both active and non-active, the bars promote the inflow of gas, transporting angular momentum outwards (e.g. Kormendy 2013). This makes it more challenging to detect differences in λR between twins than in the case of the non-barred galaxies.
Another possibility is that the gas has an external origin (i.e. minor mergers) in the case of the active galaxies. As we mentioned in Sect. 2, our sample does not include major mergers and clearly interacting systems, but based only on the SDSS images we cannot rule out the presence of minor mergers; see Smirnova et al. (2010) for a comparison between SDSS and deep optical images of apparently isolated Seyfert galaxies. Thus, gas-rich minor mergers constitute another possible explanation for the results presented in this work if they are prevalent in AGN: not only do these minor mergers promote spiral structure (Purcell et al. 2011) therefore increasing the disc λR, but they also provide gas supply that can potentially trigger nuclear activity (e.g. Neistein & Netzer 2014; Tadhunter et al. 2014). Deeper optical imaging is required to detect low surface brightness features indicative of merging activity (Ramos Almeida et al. 2011).
In the framework of these interpretations, it would also be relevant to look for differences between the actual specific angular momenta of the active and non-active twins. To do that we use j*, the stellar specific angular momentum (Fall 1983; Romanowsky & Fall 2012; see Appendix D). To compare with λR, we computed j* in the disc-dominated region and show the j*–M* diagram in Appendix D. We find that 50% of the pairs show positive/negative differences in j*, and this is also valid if we calculate the total j* values (i.e. including the bulge-dominated region). This would imply that AGN are triggered in discs in which a redistribution of angular momentum has happened (resulting in similar j* and higher λR), but not necessarily in galaxies with higher/lower angular momentum or with higher/lower circular velocities (and thus more/less massive haloes). Nevertheless, we cannot rule out an underestimation of the j* values calculated for our sample because of the limited field of view of the CALIFA data. According to Romanowsky & Fall (2012) at least 2 Re are necessary to estimate j* reliably3, and 16 out of the 25 galaxies in our sample have Rout < 2 Re.
Finding galaxy-scale differences between the active galaxies and their non-active twins appears puzzling because AGN are now understood as a short and likely episodic phase of galaxy evolution. The lifetimes of AGN are estimated to be ≤100 Myr (e.g. Martini 2004; Hopkins et al. 2005), which represents a tiny fraction of the time that any change in galaxy morphology and dynamics might take (e.g. Combes 2005; Lotz et al. 2008). Therefore, if all SMBHs go through an active phase we should not expect any large-scale difference between the twins. The result shown in Fig. 2 could then imply that not every galaxy goes through an active fase, at least in the redshift and mass range considered in this work.
This Letter shows, for the first time, tentative evidence that the discs of AGN in seemingly isolated spiral galaxies of intermediate stellar masses (1010 < M* < 1011 M⊙) present larger rotational support than their non-active twins. Performing one-to-one comparisons rather than the commonly used AGN versus control sample studies was fundamental to spot this. This result needs to be further explored and confirmed for a larger sample of active and non-active galaxies, preferably using integral field data of higher angular and spectral resolution and larger spatial coverage.
For NGC 2540, Méndez-Abreu et al. (2017) did not include a bulge in their photometric decomposition, but a nuclear point source. We thus estimated  using the average ratio of Rout/
 of all the galaxies with the same morphological type (SBbc) in our sample.
We note that NGC 2540 does not have B/T value (see Sect. 3).
This is not the case for λR, which is usually measured within 1 Re.
Acknowledgments
We thank R. Morganti, C. Tadhunter, F. Combes, C. Lagos, J. Méndez-Abreu and V. Kalinova for useful suggestions. We thank the referee for carefully reading our manuscript and providing constructive comments. This study uses data provided by the Calar Alto Legacy Integral Field Area (CALIFA) survey (http://califa.caha.es/). Based on observations collected at the Centro Astronómico Hispano Alemán (CAHA) at Calar Alto, operated jointly by the MPIA and the IAA-CSIC. IMC acknowledges the support of the IAC. BGL, CRA, TRL, PSB, IM and JM acknowledge support from the Spanish Ministry of Science, Innovation and Universities (MCIU), the Agencia Estatal de Investigación (AEI) and the Fondo Europeo de Desarrollo Regional (EU FEDER) under projects with references PID2019-107010GB-I00, PID2019-106027GB-C42, AYA2015-68217-P, AYA2016-76682-C3-2-P, AYA2017-89076-P, AYA2016-77237-C3-1-P, AYA2015-63810-P and AYA2016-76682-C3-1-P. CRA and TRL also acknowledge support from the MCIU under grants with reference RYC-2014-15779 and FJCI-2016-30342, respectively. IMC, BGL, CRA, TRL, IM and JM acknowledge financial support from the State Agency for Research of the Spanish MCIU through the “Center of Excellence Severo Ochoa” award to the Instituto de Astrofísica de Canarias (SEV-2015-0548) and to the Instituto de Astrofísica de Andalucía (SEV-2017-0709). SFS thanks CONACYT CB-285080 and FC-2016-01-1916, and PAPIIT-IN100519 projects for their support.
References
- Alexander, D. M., & Hickox, R. C. 2012, New Astron. Rev., 56, 93 [NASA ADS] [CrossRef] [Google Scholar]
- Baldwin, J. A., Phillips, M. M., & Terlevich, R. 1981, PASP, 93, 5 [NASA ADS] [CrossRef] [EDP Sciences] [Google Scholar]
- Barrera-Ballesteros, J. K., Falcón-Barroso, J., García-Lorenzo, B., et al. 2014, A&A, 568, A70 [NASA ADS] [CrossRef] [EDP Sciences] [Google Scholar]
- Bundy, K., Bershady, M. A., Law, D. R., et al. 2015, ApJ, 798, 7 [NASA ADS] [CrossRef] [Google Scholar]
- Cappellari, M. 2016, ARA&A, 54, 597 [NASA ADS] [CrossRef] [Google Scholar]
- Cappellari, M. 2017, MNRAS, 466, 798 [NASA ADS] [CrossRef] [Google Scholar]
- Cappellari, M., & Copin, Y. 2003, MNRAS, 342, 345 [NASA ADS] [CrossRef] [Google Scholar]
- Cappellari, M., & Emsellem, E. 2004, PASP, 116, 138 [NASA ADS] [CrossRef] [Google Scholar]
- Cappellari, M., Emsellem, E., Krajnović, D., et al. 2011, MNRAS, 413, 813 [NASA ADS] [CrossRef] [Google Scholar]
- Cid Fernandes, R., Stasińska, G., Schlickmann, M. S., et al. 2010, MNRAS, 403, 1036 [NASA ADS] [CrossRef] [Google Scholar]
- Colless, M. 2018, Proc. IAU, 14, 215 [CrossRef] [Google Scholar]
- Combes, F. 2005, Sci. Am., 293, 42 [CrossRef] [Google Scholar]
- Cortese, L., Fogarty, L. M. R., Bekki, K., et al. 2016, MNRAS, 463, 170 [NASA ADS] [CrossRef] [Google Scholar]
- Croom, S. M., Lawrence, J. S., Bland-Hawthorn, J., et al. 2012, MNRAS, 421, 872 [NASA ADS] [Google Scholar]
- del Moral-Castro, I., García-Lorenzo, B., Ramos Almeida, C., et al. 2019, MNRAS, 485, 3794 [NASA ADS] [CrossRef] [Google Scholar]
- Emsellem, E., Cappellari, M., Krajnović, D., et al. 2007, MNRAS, 379, 401 [NASA ADS] [CrossRef] [Google Scholar]
- Emsellem, E., Cappellari, M., Krajnović, D., et al. 2011, MNRAS, 414, 888 [Google Scholar]
- Fabian, A. C. 2012, ARA&A, 50, 455 [Google Scholar]
- Falcón-Barroso, J., Bacon, R., Bureau, M., et al. 2006, MNRAS, 369, 529 [Google Scholar]
- Falcón-Barroso, J., Lyubenova, M., van de Ven, G., et al. 2017, A&A, 597, A48 [NASA ADS] [CrossRef] [EDP Sciences] [Google Scholar]
- Falcón-Barroso, J., van de Ven, G., Lyubenova, M., et al. 2019, A&A, 632, A59 [CrossRef] [EDP Sciences] [Google Scholar]
- Fall, S. M. 1983, IAU Symp., 100, 391 [Google Scholar]
- García-Benito, R., Zibetti, S., Sánchez, S. F., et al. 2015, A&A, 576, A135 [NASA ADS] [CrossRef] [EDP Sciences] [Google Scholar]
- García-Burillo, S., Combes, F., Schinnerer, E., Boone, F., & Hunt, L. K. 2005, A&A, 441, 1011 [NASA ADS] [CrossRef] [EDP Sciences] [Google Scholar]
- Graham, M. T., Cappellari, M., Li, H., et al. 2018, MNRAS, 477, 4711 [Google Scholar]
- Ho, L. C. 2008, ARA&A, 46, 475 [Google Scholar]
- Hopkins, P. F., Hernquist, L., Cox, T. J., et al. 2005, ApJ, 630, 716 [Google Scholar]
- Ilha, G. S., Riffel, R. A., Schimoia, J. S., et al. 2019, MNRAS, 484, 252 [Google Scholar]
- Kalinova, V., Colombo, D., Rosolowsky, E., et al. 2017, MNRAS, 469, 2539 [Google Scholar]
- Kewley, L. J., Dopita, M. A., Sutherland, R. S., Heisler, C. A., & Trevena, J. 2001, ApJ, 556, 121 [Google Scholar]
- Kormendy, J. 2013, in Secular Evolution in Disk Galaxies, eds. J. Falcón-Barroso, & J. H. Knapen, 1 [Google Scholar]
- Kormendy, J., & Ho, L. C. 2013, ARA&A, 51, 511 [Google Scholar]
- Krajnović, D., Alatalo, K., Blitz, L., et al. 2013, MNRAS, 432, 1768 [Google Scholar]
- Lacerda, E. A. D., Sánchez, S. F., Cid Fernandes, R., et al. 2020, MNRAS, 492, 3073 [Google Scholar]
- Lotz, J. M., Jonsson, P., Cox, T. J., & Primack, J. R. 2008, MNRAS, 391, 1137 [Google Scholar]
- Ma, C.-P., Greene, J. E., McConnell, N., et al. 2014, ApJ, 795, 158 [Google Scholar]
- Martini, P. 2004, in Coevolution of Black Holes and Galaxies, ed. L. C. Ho, 169 [Google Scholar]
- Méndez-Abreu, J., Ruiz-Lara, T., Sánchez-Menguiano, L., et al. 2017, A&A, 598, A32 [NASA ADS] [CrossRef] [EDP Sciences] [Google Scholar]
- Neistein, E., & Netzer, H. 2014, MNRAS, 437, 3373 [Google Scholar]
- Ocvirk, P., Pichon, C., Lançon, A., & Thiébaut, E. 2006a, MNRAS, 365, 46 [NASA ADS] [CrossRef] [Google Scholar]
- Ocvirk, P., Pichon, C., Lançon, A., & Thiébaut, E. 2006b, MNRAS, 365, 74 [Google Scholar]
- Purcell, C. W., Bullock, J. S., Tollerud, E. J., Rocha, M., & Chakrabarti, S. 2011, Nature, 477, 301 [Google Scholar]
- Ramos Almeida, C., & Ricci, C. 2017, Nat. Astron., 1, 679 [Google Scholar]
- Ramos Almeida, C., Tadhunter, C. N., Inskip, K. J., et al. 2011, MNRAS, 410, 1550 [NASA ADS] [Google Scholar]
- Rembold, S. B., Shimoia, J. S., Storchi-Bergmann, T., et al. 2017, MNRAS, 472, 4382 [Google Scholar]
- Romanowsky, A. J., & Fall, S. M. 2012, ApJS, 203, 17 [Google Scholar]
- Saha, K., & Jog, C. J. 2014, MNRAS, 444, 352 [Google Scholar]
- Sánchez, S. F., Kennicutt, R. C., Gil de Paz, A., et al. 2012, A&A, 538, A8 [NASA ADS] [CrossRef] [EDP Sciences] [Google Scholar]
- Sánchez, S. F., García-Benito, R., Zibetti, S., et al. 2016, A&A, 594, A36 [NASA ADS] [CrossRef] [EDP Sciences] [Google Scholar]
- Sánchez, S. F., Avila-Reese, V., Hernandez-Toledo, H., et al. 2018, Rev. Mex. Astron. Astrofis., 54, 217 [Google Scholar]
- Sarzi, M., Falcón-Barroso, J., Davies, R. L., et al. 2006, MNRAS, 366, 1151 [Google Scholar]
- Smirnova, A. A., Moiseev, A. V., & Afanasiev, V. L. 2010, MNRAS, 408, 400 [Google Scholar]
- Storchi-Bergmann, T., & Schnorr-Müller, A. 2019, Nat. Astron., 3, 48 [Google Scholar]
- Tadhunter, C., Dicken, D., Morganti, R., et al. 2014, MNRAS, 445, L51 [Google Scholar]
- van de Sande, J., Scott, N., Bland-Hawthorn, J., et al. 2018, Nat. Astron., 2, 483 [Google Scholar]
- Veale, M., Ma, C.-P., Greene, J. E., et al. 2017, MNRAS, 471, 1428 [Google Scholar]
- Walcher, C. J., Wisotzki, L., Bekeraité, S., et al. 2014, A&A, 569, A1 [NASA ADS] [CrossRef] [EDP Sciences] [Google Scholar]
Appendix A: SDSS images
Here we include the colour-composite SDSS images of our sample of active and non-active twin galaxies (Fig. A.1).
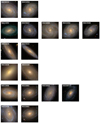 |
Fig. A.1. Colour-composite SDSS images of the active galaxies (left column) and their corresponding non-active twin(s). For AGN with more than one twin, the best twin is the one shown next to the AGN. Each image has a field of view of 90″ × 90″. North is up and east to the left. |
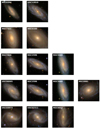 |
Fig. A.1. continued. |
Appendix B: Deprojected λR values
To deproject the individual λR values we use the following equation from Appendix B of Emsellem et al. (2011):
 (B.1)
(B.1)
where  , i the galaxy inclination, and β the anisotropy parameter. To estimate C for each galaxy we use the median value of β for its Hubble type (βSa = 0.30, βSb = 0.34, βSbc = 0.29 from Table B.1 in Kalinova et al. 2017). The individual
  are reported in Table 1. This deprojection introduces additional errors, including assumptions on internal galaxy dynamics. In an attempt to quantify this, we estimate conservative errors by taking into account the ellipticity errors from Méndez-Abreu et al. (2017), the statistical λR uncertainties, and the β standard deviation of the corresponding Hubble type.
Appendix C: Alternative figures
Here we include two alternative versions of Fig. 2, with different colours indicating differences in light-weighted averaged stellar age (Fig. C.1) and in B/T from SDSS r-band photometry (Fig. C.2) between the twins.
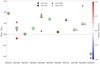 |
Fig. C.1. Same as Fig. 2 but with the colour code indicating differences in averaged luminosity-weighted stellar age measured in the same region as λR. |
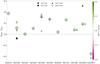 |
Fig. C.2. Same as in Fig. 2 but with the colour code indicating differences in B/T from SDSS r-band photometry (Méndez-Abreu et al. 2017). The best twin of each AGN is indicated with a red circle. NGC 2540 does not have B/T value reported in Méndez-Abreu et al. (2017) and thus its corresponding ΔλR appears as a black square. |
Appendix D: Total specific angular momentum
To compute the j* values of our galaxies as a proxy for the specific angular momentum (J), we use the methodology outlined by Romanowsky & Fall (2012) and adapted by Cortese et al. (2016) to IFS data as it follows
 (D.1)
(D.1)
where Ri, Fi, and Vi are the galactocentric radius, flux, and stellar velocity per spatial bin. We calculate the j* values in the same region than λR (i.e. disc-dominated; see Sect. 3).
In Fig. D.1 we show the j*–M* diagram of the active and non-active galaxies in our sample. The scatter of this plot is strongly correlated with galaxy morphology (Fall 1983; Cortese et al. 2016), something that we also see for our galaxies, which include Sa, SBb, and S(B)bc types.
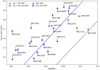 |
Fig. D.1. Active and non-active galaxies j*–M* diagram in our sample. The values of j* corresponds to the disc-dominated region defined in Sect. 3. The filled symbols correspond to AGN and open symbols to non-active galaxies. The colours correspond to Hubble type (green to Sa and SBb and blue to S(B)bc galaxies). The green and blue lines correspond to the linear fits to S0/Sa-Sb and Sbc/later types from Cortese et al. (2016) within 1 Re for comparison. |
j* values for the sample.
All Tables
All Figures
|
Fig. 1. Colour-composite SDSS images and CALIFA stellar flux, velocity, and velocity dispersion maps (from top to bottom) of one pair of twin galaxies: NGC 0214 (AGN; left column) and NGC 2253 (non-AGN; right column). The white ellipses indicate the boundaries of disc region defined in Sect. 3 (2 |
| In the text | |
|
Fig. 2. Differences in stellar λR between the pairs of twin galaxies. The best twin of each AGN is indicated with a green circle. Each column corresponds to an active galaxy and each symbol to the difference in λR with each of its twins. The colour code indicates the difference in ellipticity (ϵAGN − ϵtwin, see Table 1). Error bars correspond to propagation of the individual uncertainties (see Sect. 3). |
| In the text | |
|
Fig. A.1. Colour-composite SDSS images of the active galaxies (left column) and their corresponding non-active twin(s). For AGN with more than one twin, the best twin is the one shown next to the AGN. Each image has a field of view of 90″ × 90″. North is up and east to the left. |
| In the text | |
|
Fig. A.1. continued. |
| In the text | |
|
Fig. C.1. Same as Fig. 2 but with the colour code indicating differences in averaged luminosity-weighted stellar age measured in the same region as λR. |
| In the text | |
|
Fig. C.2. Same as in Fig. 2 but with the colour code indicating differences in B/T from SDSS r-band photometry (Méndez-Abreu et al. 2017). The best twin of each AGN is indicated with a red circle. NGC 2540 does not have B/T value reported in Méndez-Abreu et al. (2017) and thus its corresponding ΔλR appears as a black square. |
| In the text | |
|
Fig. D.1. Active and non-active galaxies j*–M* diagram in our sample. The values of j* corresponds to the disc-dominated region defined in Sect. 3. The filled symbols correspond to AGN and open symbols to non-active galaxies. The colours correspond to Hubble type (green to Sa and SBb and blue to S(B)bc galaxies). The green and blue lines correspond to the linear fits to S0/Sa-Sb and Sbc/later types from Cortese et al. (2016) within 1 Re for comparison. |
| In the text | |
Current usage metrics show cumulative count of Article Views (full-text article views including HTML views, PDF and ePub downloads, according to the available data) and Abstracts Views on Vision4Press platform.
Data correspond to usage on the plateform after 2015. The current usage metrics is available 48-96 hours after online publication and is updated daily on week days.
Initial download of the metrics may take a while.