Fig. 6.
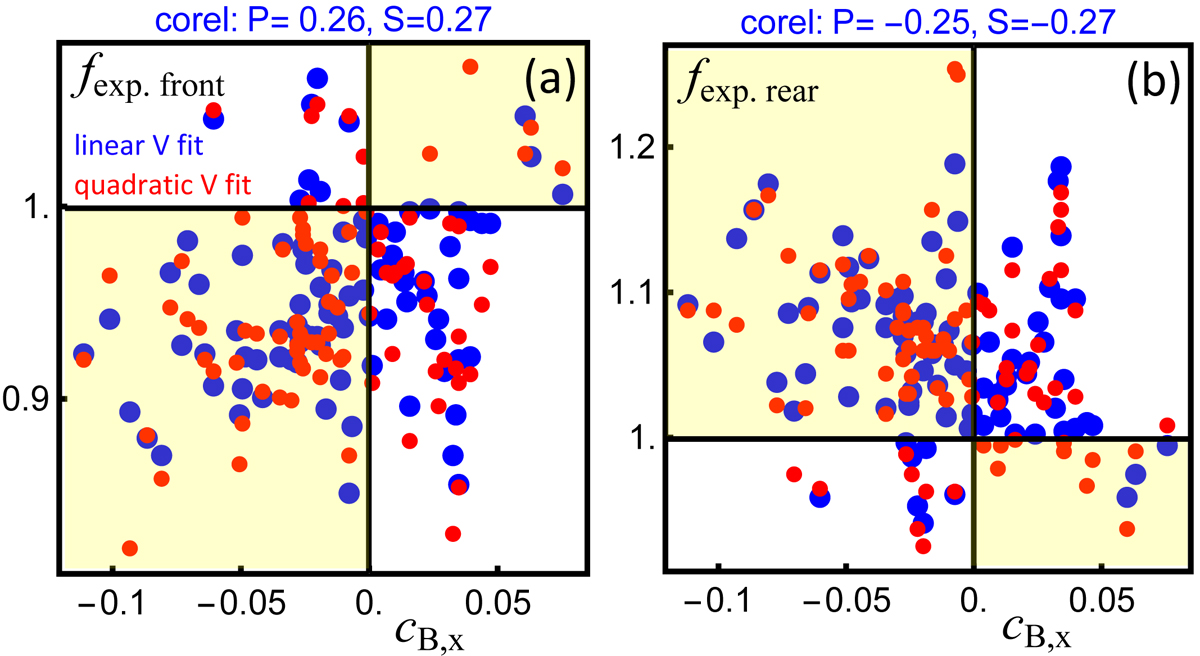
Expansion factors (a) at the front and (b) at the rear MC boundaries as a function of the magnetic asymmetry coefficient cB, x, i.e. Eq. (24) applied to the magnetic data. The results of linear (blue) and quadratic (red) fits for a given MC are shown with two nearby points located on the same vertical line. The model fit derived from Eq. (21) (in green in earlier figures) is omitted because the results are similar. The Pearson (P) and Spearman (S) correlation coefficients are reported at the top of each panel for linear velocity fits. The ageing effect alone is expected to create a magnetic asymmetry that is correlated with the expansion factors, so that for asymmetry due to ageing, data points are expected to be included in the yellow regions.
Current usage metrics show cumulative count of Article Views (full-text article views including HTML views, PDF and ePub downloads, according to the available data) and Abstracts Views on Vision4Press platform.
Data correspond to usage on the plateform after 2015. The current usage metrics is available 48-96 hours after online publication and is updated daily on week days.
Initial download of the metrics may take a while.