Fig. 5.
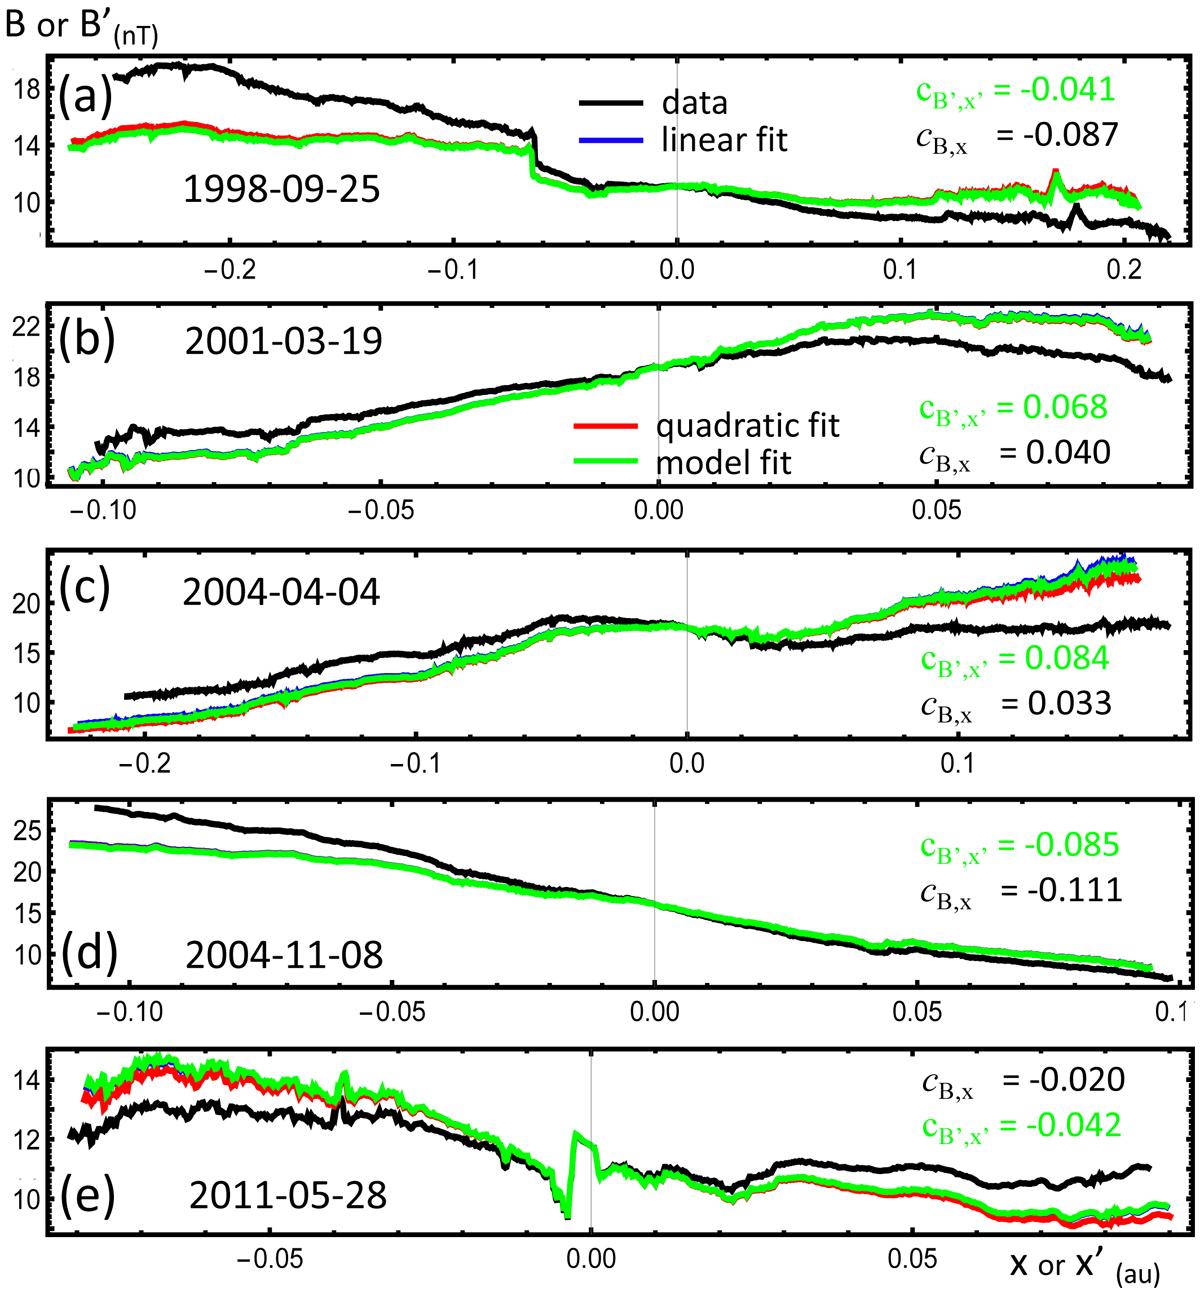
Magnetic field magnitude, B, across the same MCs as shown in Figs. 1 and 3. The black lines show the original data vs. the spatial coordinate x, Eq. (2), along the spacecraft trajectory. The coloured curves show the results of removing the ageing effect both on B and x with the expansion factors shown in Fig. 3, so that they show B′(x′) (Eqs. (27) and (28)). The plotting order is black, blue, red, and green lines, and the model fit curves mostly mask the underlying results obtained with other fits. Two magnetic asymmetry values, cB, x and cB′,x′, are reported on the right side of each panel (with the same colour convention).
Current usage metrics show cumulative count of Article Views (full-text article views including HTML views, PDF and ePub downloads, according to the available data) and Abstracts Views on Vision4Press platform.
Data correspond to usage on the plateform after 2015. The current usage metrics is available 48-96 hours after online publication and is updated daily on week days.
Initial download of the metrics may take a while.