Open Access
Fig. 4.
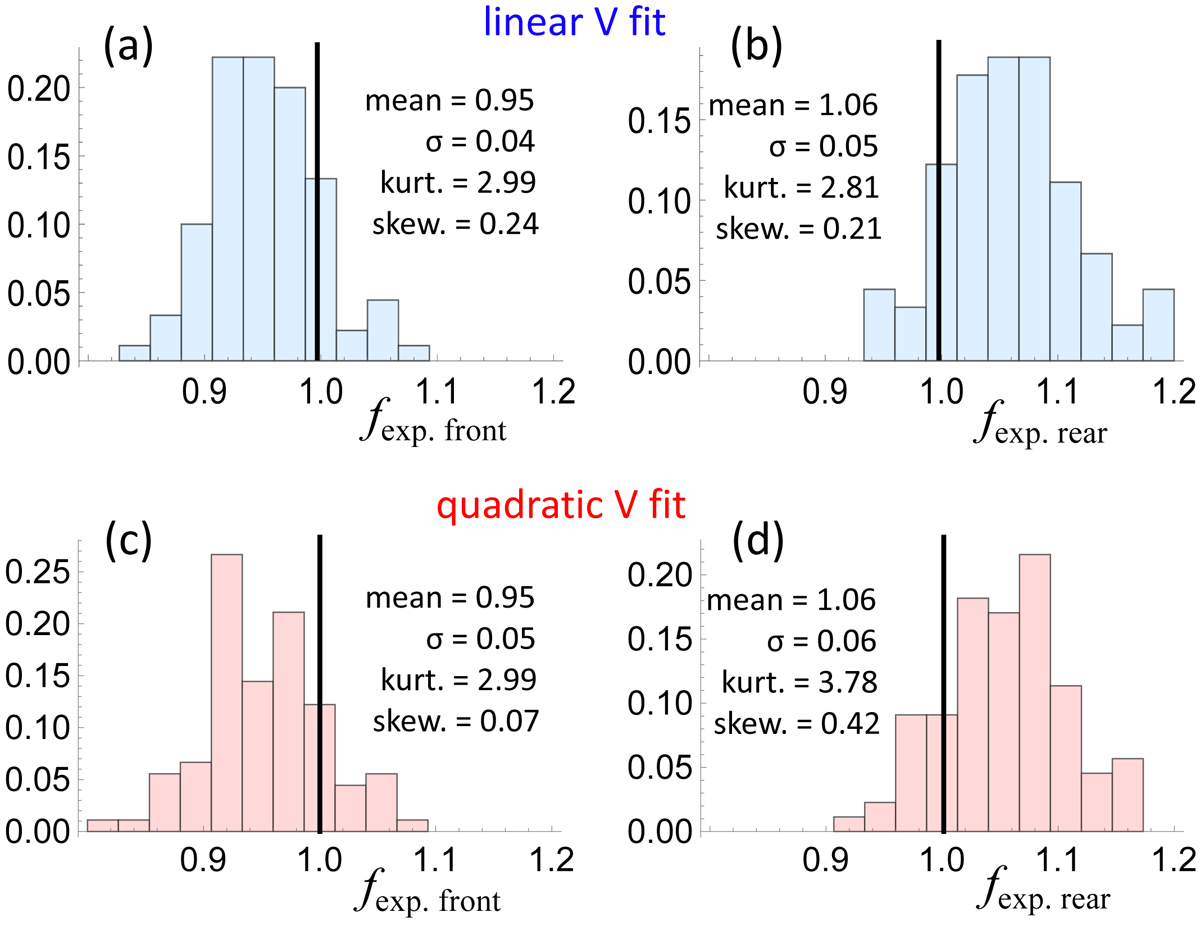
Histograms of the expansion factors ffit, Eq. (16), computed (a and c) at the front, and (b and d) at the rear MC boundaries. They are the extreme values of f(t) across MCs. ffit values are derived from linear (top) and quadratic (bottom) fits of the observed velocities (similar results are obtained with the model fit).
Current usage metrics show cumulative count of Article Views (full-text article views including HTML views, PDF and ePub downloads, according to the available data) and Abstracts Views on Vision4Press platform.
Data correspond to usage on the plateform after 2015. The current usage metrics is available 48-96 hours after online publication and is updated daily on week days.
Initial download of the metrics may take a while.