Fig. 2.
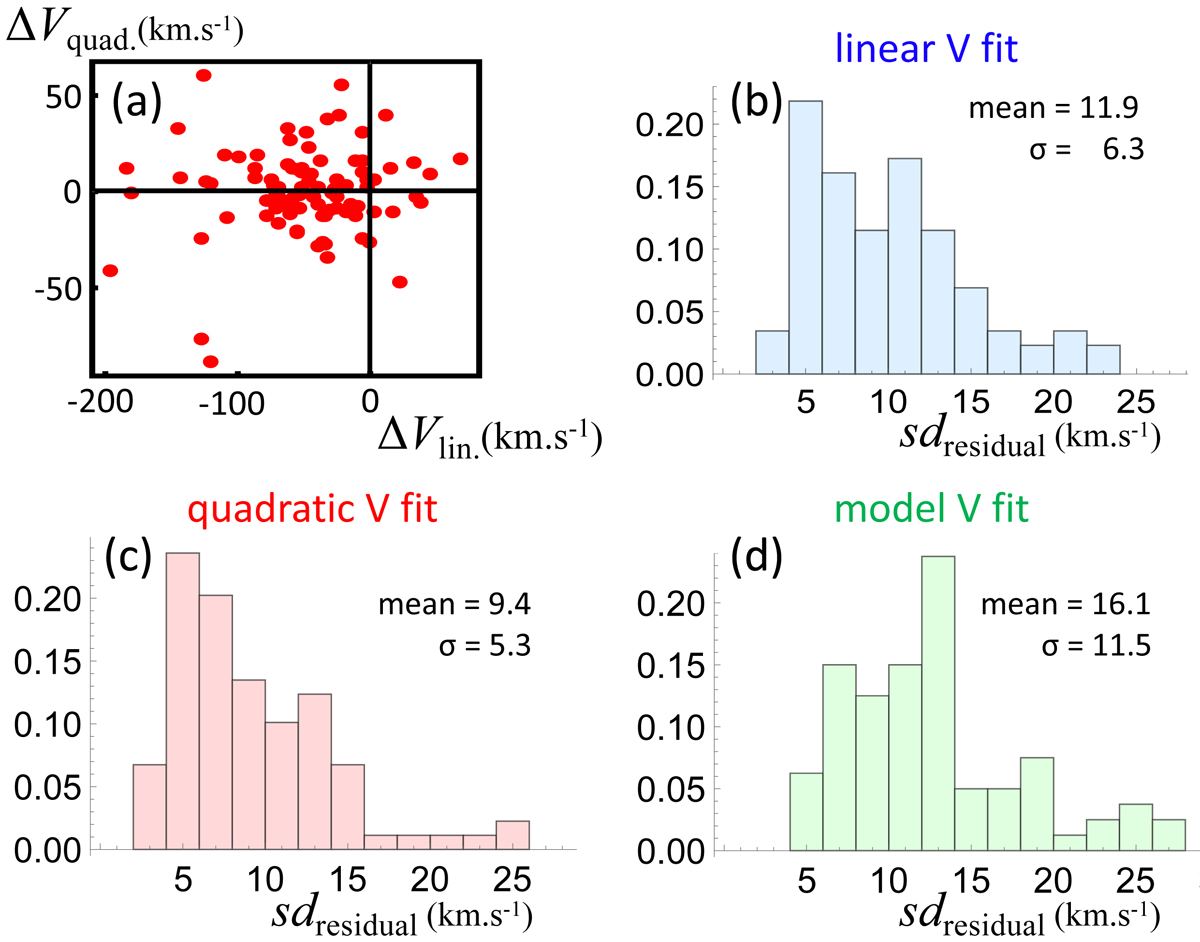
Fit properties for the 90 MCs we studied. (a) Maximum contribution across the MCs of the quadratic term, ΔVquad = c (Δt/2)2 as a function of the linear variation of velocity ΔVlin = b Δt. Δt is the MC duration, and b and c are the coefficients of Eq. (15) fitted to the velocity data. (b–d) Histograms of the standard deviation of residuals between the velocity fits and the data. The linear, quadratic, and model fits are plotted in light blue, red, and green, respectively.
Current usage metrics show cumulative count of Article Views (full-text article views including HTML views, PDF and ePub downloads, according to the available data) and Abstracts Views on Vision4Press platform.
Data correspond to usage on the plateform after 2015. The current usage metrics is available 48-96 hours after online publication and is updated daily on week days.
Initial download of the metrics may take a while.