Fig. 1.
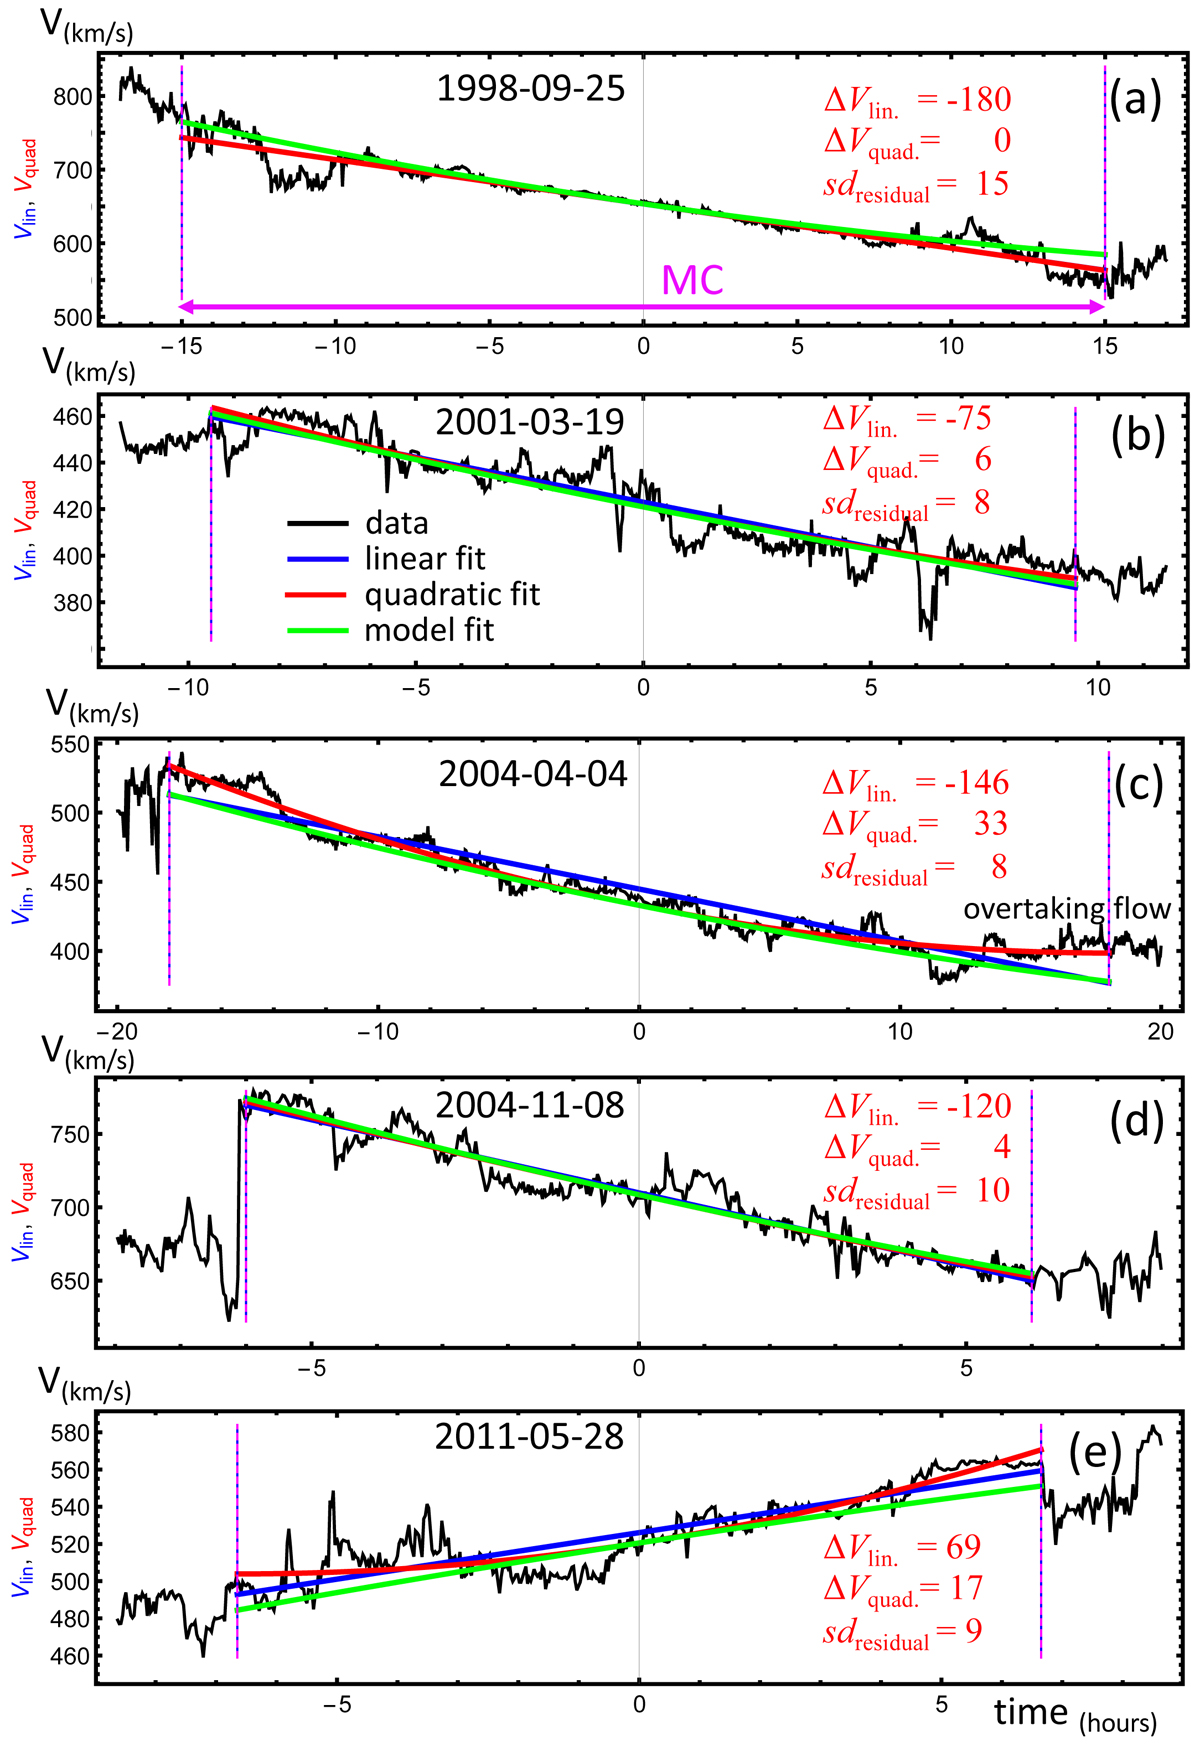
Examples of velocities measured in situ (black) and fitted results (colours) for five MCs. The labels in the top of the plots indicate the day of the MC front. Linear (in blue) and quadratic (in red) least square fits, Eq. (15), of the observed velocity are over-plotted. The model fit (in green) is an approximation of Eq. (19) (Taylor expansion to second order, so Eq. (21)). The purple vertical lines define the boundaries of the MCs and the range of the velocity fits. Two hours of data are added before and after these boundaries to show the MC context. The time origin is set at MC centre, i.e. tc = (tstart + tend)/2. The main characteristics of the quadratic fit are added in red font; all are in km s−1 (see Sect. 3.2).
Current usage metrics show cumulative count of Article Views (full-text article views including HTML views, PDF and ePub downloads, according to the available data) and Abstracts Views on Vision4Press platform.
Data correspond to usage on the plateform after 2015. The current usage metrics is available 48-96 hours after online publication and is updated daily on week days.
Initial download of the metrics may take a while.