Free Access
Fig. 3
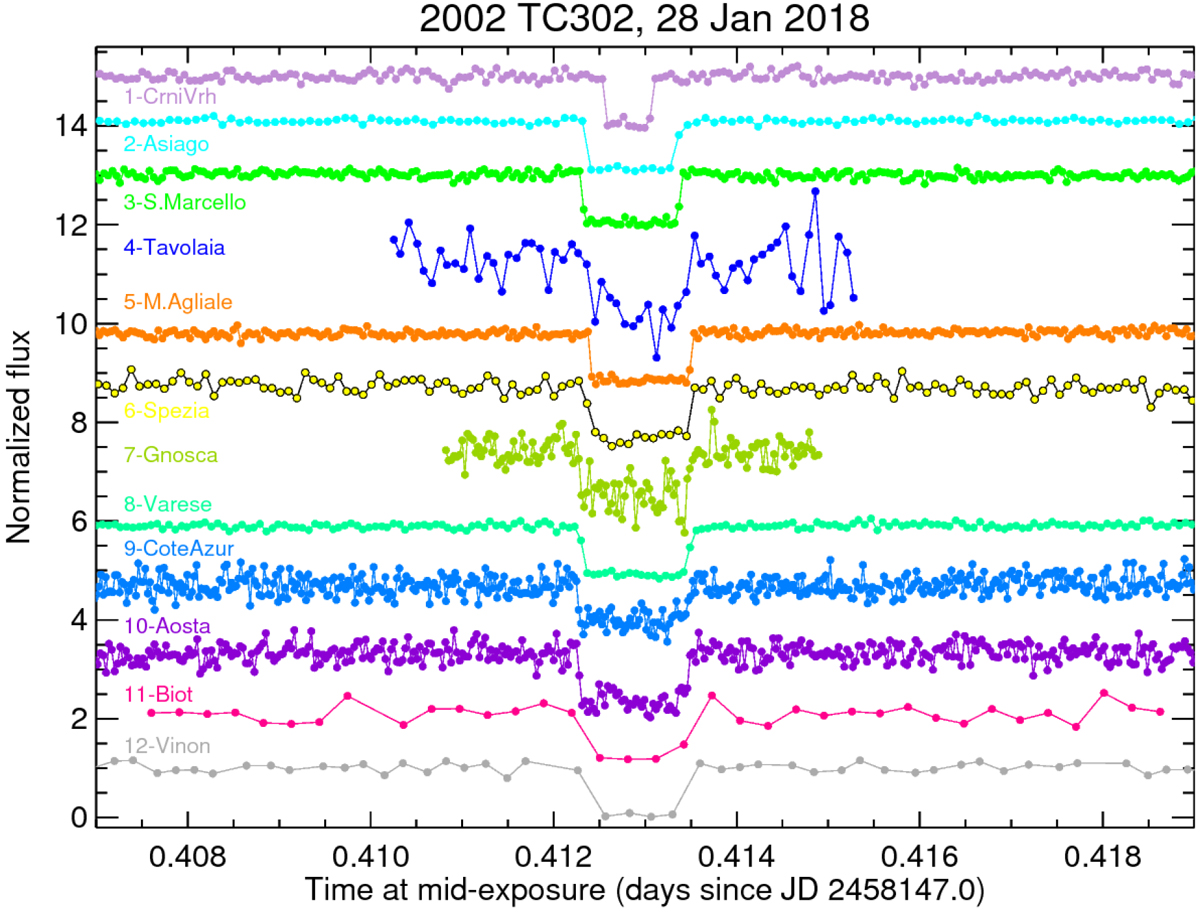
Light curves in normalized flux from all the observatories. The light curves have been displaced in the horizontal axis to account for the different longitudes so that all the occultation drops are visually aligned.
Current usage metrics show cumulative count of Article Views (full-text article views including HTML views, PDF and ePub downloads, according to the available data) and Abstracts Views on Vision4Press platform.
Data correspond to usage on the plateform after 2015. The current usage metrics is available 48-96 hours after online publication and is updated daily on week days.
Initial download of the metrics may take a while.