Fig. 8
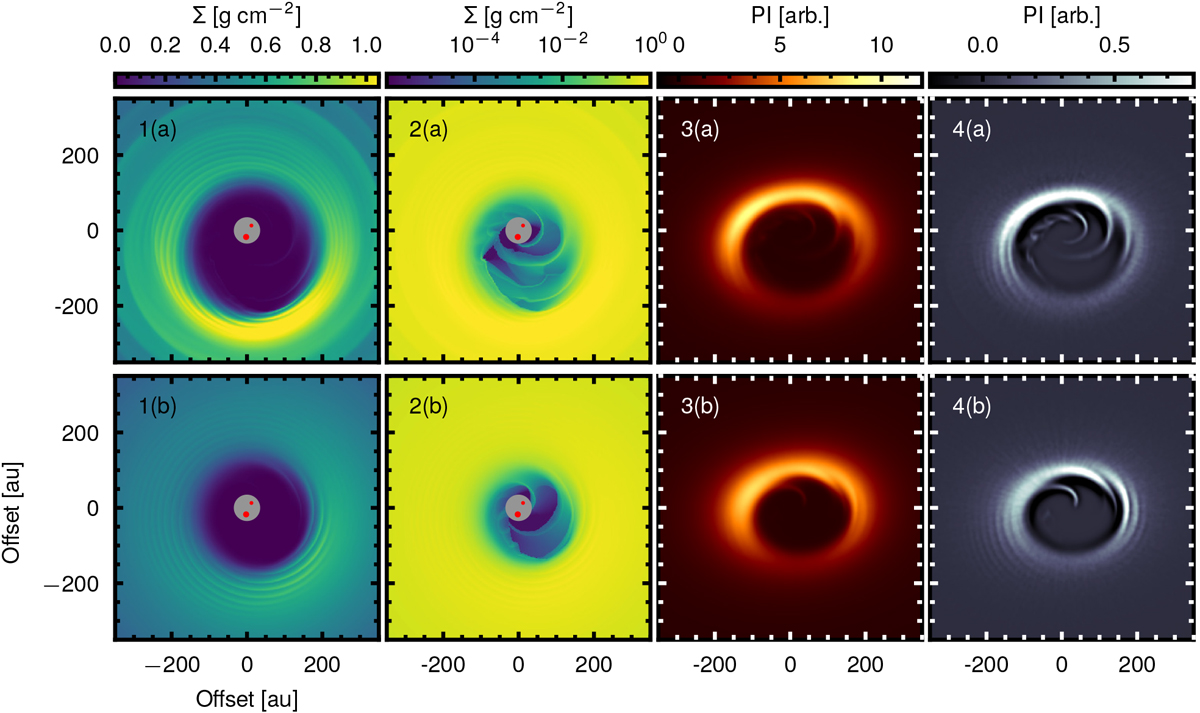
Surface density output of our simulations in linear (left column; 1(a) and (b)) and logarithmic (center left column; 2(a) and (b)) color stretch. The center right column (3(a) and (b)) shows the simulated polarized intensity images evaluated at 1.67 μm. This image was calculated after inclining and orienting the disk as in the observations. The right column (4(a) and (b)) shows the polarized intensity image of the center right column, processed with a high-pass filter. In each column, the panel in the first row (a) corresponds to the model with h = 0.11, the panel in the second row (b) to h = 0.15.
Current usage metrics show cumulative count of Article Views (full-text article views including HTML views, PDF and ePub downloads, according to the available data) and Abstracts Views on Vision4Press platform.
Data correspond to usage on the plateform after 2015. The current usage metrics is available 48-96 hours after online publication and is updated daily on week days.
Initial download of the metrics may take a while.