Fig. 4
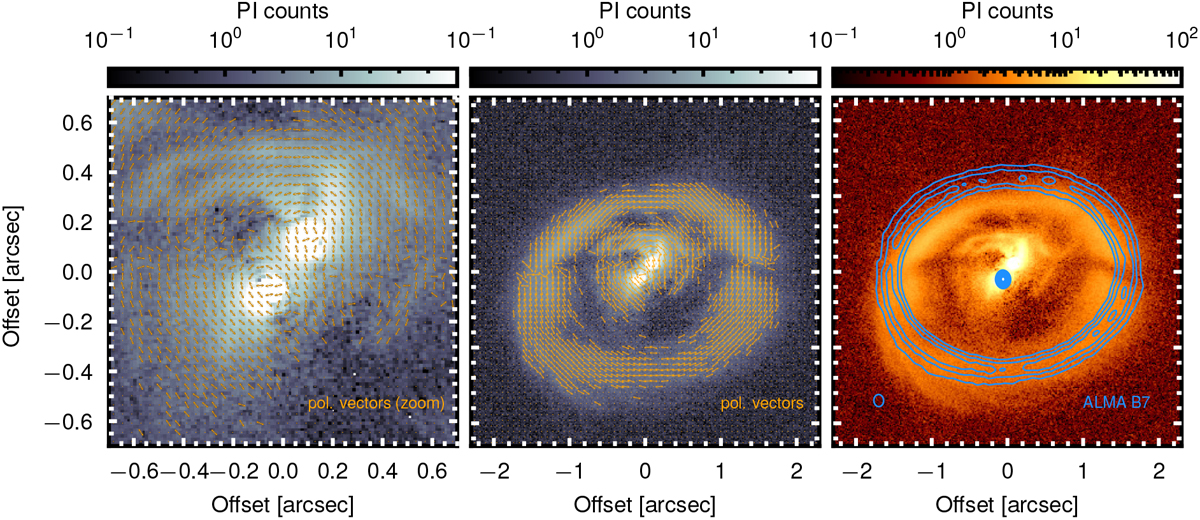
Left and center: SPHERE PI image with lines indicating the angle of linear polarization overplotted, showing two different fields of view (0.7″ × 0.7″, 2.3″ × 2.3″). The lines have an arbitrary length. For the computation of the polarization angles, we ignored bins at which the binned polarized intensity values ≤1.9. Right: polarized intensity image with ALMA Band 7 (0.9 mm) continuum contours overplotted (blue). The ALMA observationswere published in Phuong et al. (2020a). The ALMA image was registered such that the inner continuum emission, attributed to a circumstellar disk around Aa, coincides with the NIR position of Aa. Contours are shown at 20, 30,.., 80,90% of the peak intensity. The beam size is indicated in the lower left corner.
Current usage metrics show cumulative count of Article Views (full-text article views including HTML views, PDF and ePub downloads, according to the available data) and Abstracts Views on Vision4Press platform.
Data correspond to usage on the plateform after 2015. The current usage metrics is available 48-96 hours after online publication and is updated daily on week days.
Initial download of the metrics may take a while.