Fig. A.1
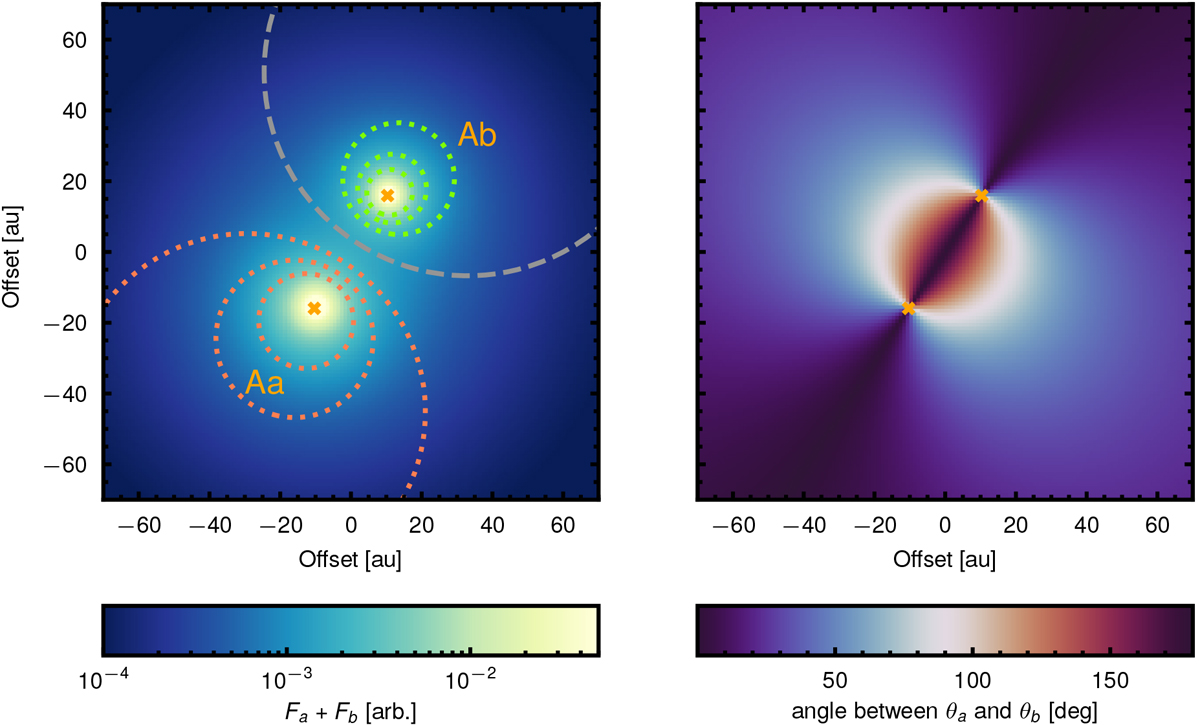
Toy model of the inner disk region of GG Tau A including two illuminating sources. The left panel shows the radiation field generated by the two stars. For each star, the dotted contours mark the regions where the contribution from the other star to the total flux is 5, 10, and 20% (in red, the contribution from GG Tau Ab in the immediate surrounding of GG Tau Aa; in green, vice versa). The grey dashed line traces the contour where Fa equals Fb. The right panel maps the angles between the linear polarization vectors resulting from scatteringof light from Aa and Ab. In regions in which this angle becomes close to 90o, PI could theoretically cancel out.
Current usage metrics show cumulative count of Article Views (full-text article views including HTML views, PDF and ePub downloads, according to the available data) and Abstracts Views on Vision4Press platform.
Data correspond to usage on the plateform after 2015. The current usage metrics is available 48-96 hours after online publication and is updated daily on week days.
Initial download of the metrics may take a while.